New Chesapeake Bay Program Data Shows Decline in Tree Cover, Increase in Impervious Surfaces Across Watershed
High-resolution data shows how land is being used throughout the Chesapeake Bay region
Annapolis, Md.—Recent analysis of land use and land cover data from the Chesapeake Bay Program’s Very-High Resolution Land Use/Land Cover and Change Data show 1,927,940 acres (3,012.4 square miles) throughout the watershed are covered by impervious surfaces. This represents 4.75% of the entire land area of the Bay watershed (an area of approximately 40,546,643 acres, or 63,354 square miles). Impervious surfaces are considered to be any area that blocks the filtration of water.
These data were captured in 2017/2018 as part of the Very-High Resolution Land Use/Land Cover and Change Data project. This innovative technology also included an update to the previous high-resolution dataset from 2013/2014 and included a new data product that describes the changes in land use and land cover throughout the Chesapeake Bay watershed from 2013/2014 and 2017/2018.
When compared to previous data mapped in 2013/2014, impervious cover increased by 50,651 acres (79.1 square miles), which is an absolute increase of 0.12% as a percentage of land area. The fastest developing regions throughout the Chesapeake Bay watershed are the suburban areas surrounding Baltimore, Maryland, Harrisburg, Pennsylvania, Richmond, Virginia and Washington, D.C.
The data finds that structures (e.g., buildings) contributed to 31.6% of the net increase in impervious surfaces, while roads only contributed to 4.2%. However, the category of “other impervious surfaces”, defined as human-constructed objects such as driveways, parking lots, runways, rail lines, etc. saw the highest increase at 64.3%. This category also includes those areas currently in interim stages of development, such as acres cleared for construction.
The Very-High Resolution Land Use/Land Cover and Change Data was also used to help understand the loss of tree canopy across the Chesapeake Bay region. While 8,307 acres of trees have been planted across the watershed between 2013/2014 and 2017/2018, over 25,000 acres of tree canopy has been lost in community areas (defined as municipalities, cities, towns, villages and boroughs by the U.S. Census).
To track real-time progress that each jurisdiction is making in planting trees to increase their canopy, the Chesapeake Bay Program uses annual progress data for three best management practices (BMPs) that are reported for the Chesapeake Bay Total Maximum Daily Load. The three BMPs are Urban Tree Planting, Urban Forest Planting and Urban Forest Buffers. As the BMP reporting only captures tree canopy gains, the Very High-Resolution Land Use/Land Cover and Change Data helps to assess losses.
Maryland, Pennsylvania and Virginia saw the highest number of trees planted in community areas during the period of 2013/2014-2017/2018, at 6,501, 915 and 445 acres, respectively. During the same time period, 359 acres were planted in the District of Columbia, 14 acres in Delaware, 40 acres in New York and 33 acres in West Virginia. It is critical to remember that Delaware, New York and West Virginia only contain a small portion of the Chesapeake Bay watershed when compared to the other four jurisdictions.
Maryland reported the greatest cumulative community tree planting, with almost 86% of the total reported acres across the watershed coming from the state. However, it also showed the greatest net loss at 4,537 acres.
Despite the overall declining trend of tree canopy across the watershed, both the District of Columbia and New York reported net gains during 2013/2014-2017/18, at 78 and 21 acres, respectively. In particular, New York exceeded its annual goal of planting five acres per year in its portion of the Chesapeake Bay watershed.
The Chesapeake Bay Program’s Forestry Workgroup, in collaboration with the U.S. Forest Service and the Chesapeake Conservancy, used the Very-High Resolution Land Use/Land Cover Data and Change Tool to develop a series of fact sheets for every county in the watershed. The Tree Cover Status and Change fact sheets includes the breakdown of land use and land cover in each county, including the net gain or loss. It also estimates the value of benefits provided by the trees in the county.
A quick snapshot includes:
*Annual benefits in reduced air pollution, stormwater runoff and carbon dioxide.
All fact sheets can be found on the Chesapeake Tree Canopy Network website.
Enhanced funding mechanisms have allowed the USFS and Environmental Protection Agency (EPA) to finance multiple projects across the watershed to increase tree plantings. Over the past two years, the EPA has leveraged money from the Infrastructure Investment and Jobs Act, in addition to their regular appropriations, to fund $9.6 million in projects to increase tree plantings in both agricultural and urban landscapes. Additionally, the USFS will invest $1.5 billion from the Inflation Recovery Act in coming years to support urban and community forest efforts not only in the Chesapeake region, but nationwide. These grants will support efforts in the Chesapeake and beyond in providing equitable access to trees and green spaces, along with the many benefits they provide.
The Very High-Resolution Land Use/Land Cover and Change Data was developed for the Chesapeake Bay Program in collaboration with the Chesapeake Conservancy, University of Vermont and the U.S. Geological Survey. The new 2017/2018 dataset includes a more detailed land use/land cover classification with enhanced technical and scientific information. Using this new information, experts also updated the 2013/14 dataset and are offering change data for the very first time.
Trees are critical to the health of the Chesapeake Bay and the water that we drink, bathe with and recreate on. They act as giant sponges, capturing rainfall, trapping polluted runoff and stabilizing soil. Trees not only produce oxygen, but their roots trap and absorb air pollutants. They help lower high air and water temperatures, helping to combat the issue of urban heat islands. Trees have also been proven to aid both mental and physical health, increase property values, generate jobs and income, lower energy costs and foster outdoor recreational activities.
Development is one of the biggest threats to forest conservation. A loss of tree canopy means a loss of valuable habitat that helps protect clean water and air, while supporting the region’s economy. As more impervious surfaces are laid across the watershed, it creates more gateways for nutrient and sediment pollution to flow into local waters and the Chesapeake Bay. Paved or hardened surfaces do not allow water to pass through, meaning that water flows over the surface, picking up pollutants as it goes. Stormwater runoff is one of the fastest growing sources of pollution impacting the Chesapeake Bay.
The Very High-Resolution Land Use/Land Cover and Change Data is the largest amount of open data that has ever been made available and it is free for anyone to use. This one-meter land use/land cover and change data is not only useful for the restoration efforts of the Chesapeake Bay Program, but also provides partner organizations and agencies with the power to practice precision restoration and conservation, making effective and impactful decisions about where to target efforts.
Using the data to monitor the conversion of natural and working landscapes is critical to minimizing the extent, and mitigating the effects, of the land conversion process. Farms, forests and wetlands provide valuable ecosystem services, producing food, improving water quality and providing wildlife habitat.
Quotes
“Impervious surfaces contribute to stormwater runoff which can transport nutrients, toxic chemicals, road salts and sediments to streams, alter stream flow and increase water temperature. Stormwater runoff is the fastest growing source of pollution to the Chesapeake Bay. Mapping impervious surfaces and monitoring how they change over time are critical for managing runoff and restoring streams and watersheds.”
"Extreme heat and more intense flooding are directly related to changes in climate. Tree canopy—particularly over asphalt—can help cool our streets and reduce flooding in a cost-effective way. This high-resolution data from the Chesapeake Bay Program enables localities to review and potentially change their programs and policies to preserve existing canopy and fill canopy gaps in an equitable manner.”
“Hyper-resolution land use data has been invaluable to Frederick County in helping to get a baseline of its tree canopy, evaluate the success of forest protections during development, identify locations for tree plantings and evaluate progress towards meeting Chesapeake Bay and local pollutant reduction goals. Our County used this information to update rules regarding new development and tree protection, and to create our Creek ReLeaf reforestation program. Hyper-resolution land use makes even stronger connections between the health of our forests, our local water bodies and the Chesapeake Bay.”
“Chesapeake Bay scientists recently cautioned that after four decades of effort, water quality has improved in some areas of the Bay but in other areas not to the degree anticipated. While their report was sobering, it also presents an opportunity to more fully adopt promising approaches to restore the Bay. Data and technology can inform and empower the Chesapeake conservation movement like never before. In this case, land use decisions in the watershed will finally be informed by both the amount and the value of tree canopy status in every county, one of the most significant factors for water quality.”
Annapolis, Md.—Recent analysis of land use and land cover data from the Chesapeake Bay Program’s Very-High Resolution Land Use/Land Cover and Change Data show 1,927,940 acres (3,012.4 square miles) throughout the watershed are covered by impervious surfaces. This represents 4.75% of the entire land area of the Bay watershed (an area of approximately 40,546,643 acres, or 63,354 square miles). Impervious surfaces are considered to be any area that blocks the filtration of water.
These data were captured in 2017/2018 as part of the Very-High Resolution Land Use/Land Cover and Change Data project. This innovative technology also included an update to the previous high-resolution dataset from 2013/2014 and included a new data product that describes the changes in land use and land cover throughout the Chesapeake Bay watershed from 2013/2014 and 2017/2018.
When compared to previous data mapped in 2013/2014, impervious cover increased by 50,651 acres (79.1 square miles), which is an absolute increase of 0.12% as a percentage of land area. The fastest developing regions throughout the Chesapeake Bay watershed are the suburban areas surrounding Baltimore, Maryland, Harrisburg, Pennsylvania, Richmond, Virginia and Washington, D.C.
The data finds that structures (e.g., buildings) contributed to 31.6% of the net increase in impervious surfaces, while roads only contributed to 4.2%. However, the category of “other impervious surfaces”, defined as human-constructed objects such as driveways, parking lots, runways, rail lines, etc. saw the highest increase at 64.3%. This category also includes those areas currently in interim stages of development, such as acres cleared for construction.
The Very-High Resolution Land Use/Land Cover and Change Data was also used to help understand the loss of tree canopy across the Chesapeake Bay region. While 8,307 acres of trees have been planted across the watershed between 2013/2014 and 2017/2018, over 25,000 acres of tree canopy has been lost in community areas (defined as municipalities, cities, towns, villages and boroughs by the U.S. Census).
To track real-time progress that each jurisdiction is making in planting trees to increase their canopy, the Chesapeake Bay Program uses annual progress data for three best management practices (BMPs) that are reported for the Chesapeake Bay Total Maximum Daily Load. The three BMPs are Urban Tree Planting, Urban Forest Planting and Urban Forest Buffers. As the BMP reporting only captures tree canopy gains, the Very High-Resolution Land Use/Land Cover and Change Data helps to assess losses.
Maryland, Pennsylvania and Virginia saw the highest number of trees planted in community areas during the period of 2013/2014-2017/2018, at 6,501, 915 and 445 acres, respectively. During the same time period, 359 acres were planted in the District of Columbia, 14 acres in Delaware, 40 acres in New York and 33 acres in West Virginia. It is critical to remember that Delaware, New York and West Virginia only contain a small portion of the Chesapeake Bay watershed when compared to the other four jurisdictions.
Maryland reported the greatest cumulative community tree planting, with almost 86% of the total reported acres across the watershed coming from the state. However, it also showed the greatest net loss at 4,537 acres.
Despite the overall declining trend of tree canopy across the watershed, both the District of Columbia and New York reported net gains during 2013/2014-2017/18, at 78 and 21 acres, respectively. In particular, New York exceeded its annual goal of planting five acres per year in its portion of the Chesapeake Bay watershed.
The Chesapeake Bay Program’s Forestry Workgroup, in collaboration with the U.S. Forest Service and the Chesapeake Conservancy, used the Very-High Resolution Land Use/Land Cover Data and Change Tool to develop a series of fact sheets for every county in the watershed. The Tree Cover Status and Change fact sheets includes the breakdown of land use and land cover in each county, including the net gain or loss. It also estimates the value of benefits provided by the trees in the county.
A quick snapshot includes:
| County | Percentage of County Tree Cover (2017-18) | Estimated Annual Benefits* | Net Gain/Loss (2013/14 to 2017/18) | ||||
| Albemarle County, Virginia | 68.7% | $76.3 million | Loss of 1,427 acres | ||||
| Anne Arundel County, Maryland | 59.5% | $69.8 million | Loss of 1,710 acres | ||||
| Broome County, New York | 64.9% | $73.5 million | Loss of 70 acres | ||||
| Hampshire County, West Virginia | 79.6% | $61 million | Loss of 458 acres | ||||
| New Castle, Delaware | 36.5% | $46 million | Loss of 650 acres | ||||
| York County, Pennsylvania | 40.1% | $89.9 million | Loss of 576 acres |
*Annual benefits in reduced air pollution, stormwater runoff and carbon dioxide.
All fact sheets can be found on the Chesapeake Tree Canopy Network website.
Enhanced funding mechanisms have allowed the USFS and Environmental Protection Agency (EPA) to finance multiple projects across the watershed to increase tree plantings. Over the past two years, the EPA has leveraged money from the Infrastructure Investment and Jobs Act, in addition to their regular appropriations, to fund $9.6 million in projects to increase tree plantings in both agricultural and urban landscapes. Additionally, the USFS will invest $1.5 billion from the Inflation Recovery Act in coming years to support urban and community forest efforts not only in the Chesapeake region, but nationwide. These grants will support efforts in the Chesapeake and beyond in providing equitable access to trees and green spaces, along with the many benefits they provide.
Facts
The Very High-Resolution Land Use/Land Cover and Change Data was developed for the Chesapeake Bay Program in collaboration with the Chesapeake Conservancy, University of Vermont and the U.S. Geological Survey. The new 2017/2018 dataset includes a more detailed land use/land cover classification with enhanced technical and scientific information. Using this new information, experts also updated the 2013/14 dataset and are offering change data for the very first time.
Trees are critical to the health of the Chesapeake Bay and the water that we drink, bathe with and recreate on. They act as giant sponges, capturing rainfall, trapping polluted runoff and stabilizing soil. Trees not only produce oxygen, but their roots trap and absorb air pollutants. They help lower high air and water temperatures, helping to combat the issue of urban heat islands. Trees have also been proven to aid both mental and physical health, increase property values, generate jobs and income, lower energy costs and foster outdoor recreational activities.
Issues
Development is one of the biggest threats to forest conservation. A loss of tree canopy means a loss of valuable habitat that helps protect clean water and air, while supporting the region’s economy. As more impervious surfaces are laid across the watershed, it creates more gateways for nutrient and sediment pollution to flow into local waters and the Chesapeake Bay. Paved or hardened surfaces do not allow water to pass through, meaning that water flows over the surface, picking up pollutants as it goes. Stormwater runoff is one of the fastest growing sources of pollution impacting the Chesapeake Bay.
Importance
The Very High-Resolution Land Use/Land Cover and Change Data is the largest amount of open data that has ever been made available and it is free for anyone to use. This one-meter land use/land cover and change data is not only useful for the restoration efforts of the Chesapeake Bay Program, but also provides partner organizations and agencies with the power to practice precision restoration and conservation, making effective and impactful decisions about where to target efforts.
Using the data to monitor the conversion of natural and working landscapes is critical to minimizing the extent, and mitigating the effects, of the land conversion process. Farms, forests and wetlands provide valuable ecosystem services, producing food, improving water quality and providing wildlife habitat.
Quotes
“Impervious surfaces contribute to stormwater runoff which can transport nutrients, toxic chemicals, road salts and sediments to streams, alter stream flow and increase water temperature. Stormwater runoff is the fastest growing source of pollution to the Chesapeake Bay. Mapping impervious surfaces and monitoring how they change over time are critical for managing runoff and restoring streams and watersheds.”
- Peter Claggett, Coordinator, Chesapeake Bay Program Land Use Workgroup and Research Geographer, U.S. Geological Survey
"Extreme heat and more intense flooding are directly related to changes in climate. Tree canopy—particularly over asphalt—can help cool our streets and reduce flooding in a cost-effective way. This high-resolution data from the Chesapeake Bay Program enables localities to review and potentially change their programs and policies to preserve existing canopy and fill canopy gaps in an equitable manner.”
- Ann Jurczyk, Chair of the Land Use and Conservation Subcommittee, Stakeholders Advisory Committee, Chesapeake Bay Program and Virginia Director of Advocacy and Outreach, Chesapeake Bay Foundation
“Hyper-resolution land use data has been invaluable to Frederick County in helping to get a baseline of its tree canopy, evaluate the success of forest protections during development, identify locations for tree plantings and evaluate progress towards meeting Chesapeake Bay and local pollutant reduction goals. Our County used this information to update rules regarding new development and tree protection, and to create our Creek ReLeaf reforestation program. Hyper-resolution land use makes even stronger connections between the health of our forests, our local water bodies and the Chesapeake Bay.”
- Shannon Moore, Member, Local Leadership Workgroup, Chesapeake Bay Program and Director, Division of Energy and Environment, Frederick County Government
“Chesapeake Bay scientists recently cautioned that after four decades of effort, water quality has improved in some areas of the Bay but in other areas not to the degree anticipated. While their report was sobering, it also presents an opportunity to more fully adopt promising approaches to restore the Bay. Data and technology can inform and empower the Chesapeake conservation movement like never before. In this case, land use decisions in the watershed will finally be informed by both the amount and the value of tree canopy status in every county, one of the most significant factors for water quality.”
- Joel Dunn, President and CEO, Chesapeake Conservancy
Author

Parul Dubey
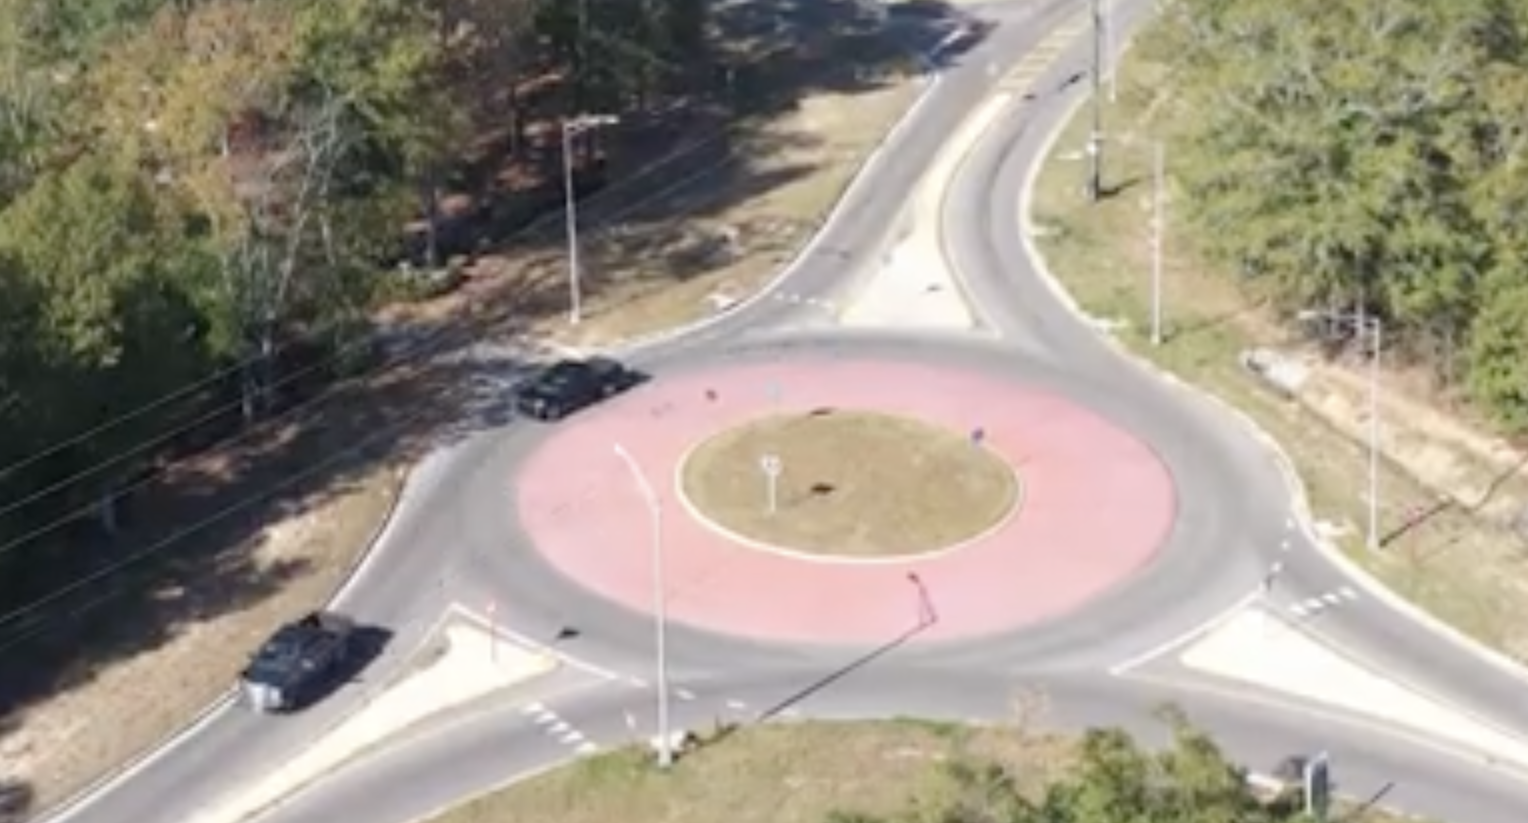
Video: New Roundabout Under Construction at McIver and Old Florence Roads in Darlington County
Promenade at The Point

June Issue 2026
.jpg?width=225)