New Index Identifies EV Leaders and Laggards in the U.S. and Europe
- HERE Technologies and SBD Automotive release comprehensive EV Index for all 50 U.S. States (and Washington D.C.) and 30 European countries.
- Only 12 U. S. States and 15 European Countries have achieved an optimal ratio of EVs-on-the-road to public chargers.
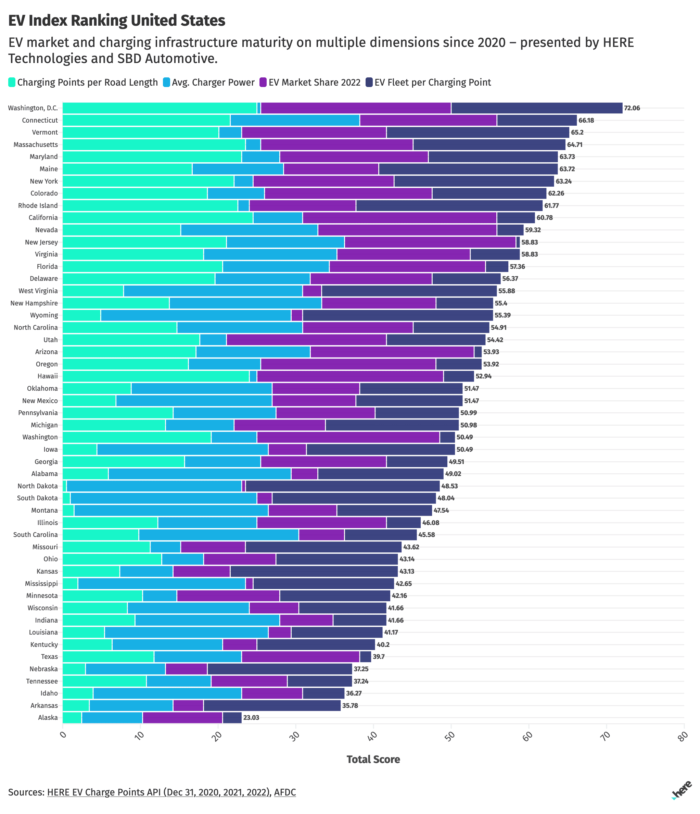
- Index shows EV market and charging infrastructure maturity on multiple dimensions since 2020.
Berlin and Detroit – To mark World EV Day on September 9, HERE Technologies, the leading location data and technology company, in conjunction with SBD Automotive, a global automotive research firm, today published an interactive index that shows the developing state of electric vehicle (EV) demand and infrastructure readiness across the United States and Europe.
The HERE-SBD Automotive EV Index highlights, since 2020, U.S. state-level and European country-level leaders and laggards based on various critical metrics, including the number of charging points (Electric Vehicle Supply Equipment), vehicle registrations, geography, and road network length.
The Index is based on the following metrics, each ranked out of a maximum score of 25 for a total score out of 100:
- How far you must drive to find a charger – number of public EV chargers per road length.
- How quickly you can charge – the average power capacity of public EV chargers.
- The number of EVs on the road versus internal combustion engine vehicles – EV fleet share.
- Likelihood of finding an unoccupied charger – the ratio of registered EVs to public chargers.
Highlights of the HERE – SBD Automotive EV Index
Every state and country has its own unique circumstances around EV adoption and charging infrastructure. In more nascent markets such as many U.S. states, it is important to use the number of registered EVs-per-charger ratio, while in more mature markets, a “power-per-EV” ratio can be more useful.
For example, California, with its large population and geographic size, had almost a million registered EVs by 2022 and one of the most developed EV charging networks in the U.S. with more than 46,000 chargers. However, California ranks among the bottom 10 states in terms of EVs per charger with a ratio of nearly 20:1.
Eight to twelve EVs per public charging point tends to be the ideal ratio for the average market to support seamless, convenient public charging, according to analysis from SBD Automotive. As the market matures, this ratio should increase as geographic coverage becomes less critical. This also prevents over-supply enabling charge point operators to turn a profit, sustaining its industry.
United States
The top overall states in the HERE – SBD Automotive EV Index
(1) Washington, D.C. (2) Connecticut (3) Vermont (4) Massachusetts (5) Maryland (6) Maine (7) New York (8) Colorado (9) Rhode Island (10) California
The bottom overall states in the HERE – SBD Automotive EV Index
(42) Wisconsin (43) Indiana (44) Louisiana (45) Kentucky (46) Texas (47) Nebraska (48) Tennessee (49) Idaho (50) Arkansas (51) Alaska
Europe
The top overall countries in the HERE – SBD Automotive EV Index
(1) Norway (2) Netherlands (3) Luxembourg (4) Germany (5) Switzerland (6) Denmark (7) Czech Republic (8) Bulgaria (9) Sweden (10) Belgium
The bottom overall countries in the HERE – SBD Automotive EV Index
(21) Italy (22) United Kingdom (23) Hungary (24) Romania (25) Ireland (26) Poland (27) Lithuania (28) Greece (29) Malta (30) Cyprus
The full rankings, interactive visuals and maps for all 50 U.S. states and 30 EU countries can be found at: https://www.here.com/ev-index
“While the maturity of charging infrastructure in each state and country generally follows population density and wealth, the index clearly demonstrates that external factors such as government incentives help equip lower-density areas with much-needed charging capacity,” said Robert Fisher, EV Principal at SBD Automotive. “Charge point operators and regulators must continue to monitor the ratio of EVs to charging stations and power availability to the size of the EV fleet in communities and along corridors to ensure a seamless ownership experience as EVs go mainstream, while at the same time protecting infrastructure operating revenue.”
“Electric vehicles are top of mind for consumers, governments and the auto industry all over the world. Stemming from the development of our EV Charge Point Predictions product, HERE and SBD have uncovered a growing discrepancy in the ratio of EV charge points to EV vehicles on the road,” said Chris Handley, Vice President of Dynamic Spatial Content at HERE Technologies. “Our analysis shows how much work needs to be done in order to usher in a fully electric mobility future.”
Key Findings:
U.S.
- With an EV market share in 2022 of just over 7%, the U.S. as a whole should ideally have eight to nine EVs per public charger, with each state having its own ideal ratio based on several market maturity metrics.
- As the market-leading state in the U.S., California’s ideal ratio would be close to twelve EVs per charger. On the other hand, North Dakota, with a large land area and very small EV fleet size, would need to aim for closer to two EVs per charger.
- One of the most important goals of the National Electric Vehicle Infrastructure (NEVI) program is to equip all regions to support inter-state travel and commerce. Thus, even though less densely populated states will struggle to achieve the same ratio of public chargers to EVs, major travel corridors will continue to be equipped with additional public charging infrastructure in the coming years through NEVI program funding, ideally enabling seamless electric mobility nationwide.
EU
- Europe is a great example of how each country approaches charging infrastructure in a different way and exists at a different point in time in the maturity of its EV market.
- The Netherlands is one of the most mature EV markets in Europe, having more than a decade of strong government support. This led to a proliferation of AC charging since DC charging had not yet been standardized. Meanwhile, Malta has very few DC chargers because, as a small island country, charging would rarely be necessary.
- A key feature of the European Commission’s infrastructure targets (AFIR) focuses on travel between EU countries, meaning that important travel and commerce corridors through countries with a low EV market penetration like Bulgaria will have a high density of chargers relative to registered EVs.
About HERE
HERE has been a pioneer in mapping and location technology for almost 40 years. Today, the HERE location platform is recognized as the most complete in the industry, powering location-based products, services and custom maps for organizations and enterprises across the globe. From autonomous driving and seamless logistics to new mobility experiences, HERE allows its partners and customers to innovate while retaining control over their data and safeguarding privacy. Find out how HERE is moving the world forward at here.com.
About SBD Automotive
SBD Automotive is a global team of automotive researchers and consultants. For 25 years, its wealth of independent data, research, and consulting has helped automakers, suppliers, investors, and governments develop safe, secure, sustainable, and seamless mobility, while delivering confidence through clarity, insight, and vision. For more information, please visit sbdautomotive.com.
Nomenclature
- Charger/charging point: one device used to concurrently exchange energy between the EV and the grid. Note that only publicly accessible chargers are included in this context.
- EV: for the purposes of this index, “EV” refers only to Battery Electric Vehicles, i.e. those vehicles that have no internal combustion engine.
Methodology
The Index compares all federal states of the U.S. (including Washington D.C.) and the EU-27, plus Norway, Switzerland and the UK. All EV charging location data was pulled from the HERE EV Charge Points API for December 1st of 2020, 2021 and 2022. Government sources include AFDC, the U.S. Census Bureau, Eurostat, EAFO, The CIA World Factbook, the ONS, and the FHWA. Only battery electric vehicles (BEVs) are included in our index.
HERE EV Charge Points collects data from public charging points. These include free, paid, and access-restricted charging stations (for example, public, yet commercial ones found on retail parking lots). Private charge stations, such as those in residential buildings, are excluded.
Levels of information in HERE EV Charge Points include charging locations, EVSEs (Electric Vehicle Supply Equipment) and connectors. Included in the API response can be addresses, hours of operation, charge station details, payment methods and availability information. Information about voltage, amps, charge modes and connector types are also supported.
Sources
U.S.
- https://afdc.energy.gov/vehicle-registration?year=2020
- https://www.census.gov/quickfacts/fact/table/US/PST045222
- https://www.fhwa.dot.gov/policyinformation/statistics/2020/hm20.cfm
- https://www.cia.gov/the-world-factbook/
- https://www.sbdautomotive.com/reports/optimizing-the-ev-user-journey
EU
- https://alternative-fuels-observatory.ec.europa.eu/transport-mode/road/eu27-uk-norway-iceland-switzerland-turkey-liechtenstein
- https://alternative-fuels-observatory.ec.europa.eu/transport-mode/road/austria
- https://www.ons.gov.uk/peoplepopulationandcommunity/populationandmigration/populationestimates/bulletins/annualmidyearpopulationestimates/mid2021
- https://ec.europa.eu/eurostat/databrowser/view/CENS_21AG/default/table?lang=en
- https://eur-lex.europa.eu/browse/eurovoc.html?params=72,7206#arrow_7206