BTS Releases Industry Snapshots

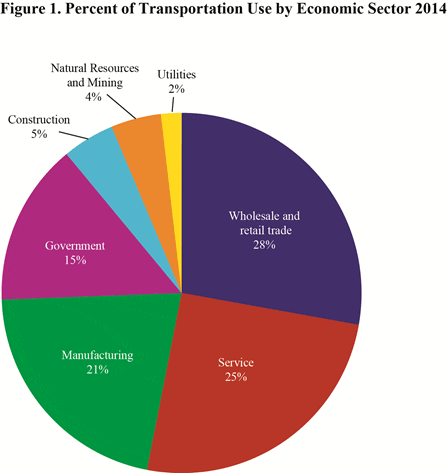
The Wholesale and Retail Trade sector relied on the most transportation services of any sector of the U.S. economy, according to Industry Snapshots: Uses of Transportation, a new report released today by the U.S. Department of Transportation’s Bureau of Transportation Statistics (BTS) (Table 1, Figure 1).
In 2014, the seven non-transportation sectors of the economy relied on more than $1 trillion in transportation services. The Wholesale and Retail Sector used $292 billion, more than one-fourth (27.8 percent) of total transportation use. The Service sector – information; financial services; professional and business services; education and health services; leisure and hospitality; and other services – also used one-fourth (25.2 percent) or $264.8 billion.
The 107-page BTS report consists of detailed analysis of the transportation reliance of each sector of the economy. The analysis includes the sector’s contribution to gross domestic product (GDP) – nationally and by state in 2015, the sector’s reliance on transportation by mode in 2014, the amount of transportation the sector requires to produce one dollar of output in 2014, the number of transportation and material moving workers employed by the sector in 2015, the median annual wage for selected transportation occupations in the sector in 2015, the number of trucks and number of truck miles accumulated by the sector in 2002, and shipment characteristics (for selected sectors) in 2012.
Other findings of the report:
- BTS estimates that transportation directly created $692.0 billion of economic activity by moving goods and people in 2014. Households contribute an additional $309.9 billion through the use of private motor vehicles.
- The Wholesale and Retail Trade sector require the most transportation per dollar of output (9.9 cents) while the Services sectors require the least (less than 3.2 cents) (Table 2).
- The Wholesale and Retail Trade sector uses the most in-house transportation ($156.5 billion) while the Manufacturing sector uses the most for-hire transportation ($161.4 billion). The Government sector has the highest percentage use of in-house transportation (60.5 percent) (Figure 2, Table 3).

Source: Bureau of Transportation Statistics, Industry Snapshots: Uses of Transportation
For-hire transportation consists of the services provided by transportation firms to industries and the public on a fee-basis, such as air carriers, railroads, transit agencies, common carrier trucking companies, and pipelines. In-house transportation is transportation activity carried out by non-transportation industries for their own purposes.
Industry Snapshots are part of Transportation Satellite Accounts (TSAs), BTS’ comprehensive measure of transportation’s economic activity in the United States.
Table 1. Transportation Use by Economic Sector 2014
($ billions)
| Sector | Transportation Use ($billions) |
|---|---|
| Wholesale and retail trade | 292.1 |
| Service | 264.8 |
| Manufacturing | 223.9 |
| Government | 152.8 |
| Construction | 48.9 |
| Natural Resources and Mining | 47.4 |
| Utilities | 19.2 |
| Total | 1049.1 |
Source: Bureau of Transportation Statistics, Industry Snapshots: Uses of Transportation
Table 2. Amount of Transportation Required to Produce a Dollar of Output by Sector 2014
| Sector | Cents |
|---|---|
| Wholesale and retail trade | 9.9 |
| Government | 4.7 |
| Utilities | 4.6 |
| Natural Resources and Mining | 4.2 |
| Construction | 3.8 |
| Manufacturing | 3.7 |
| Services* | N/A |
Transportation Requirement for Service Sectors
| Sector | Cents |
|---|---|
| Leisure and hospitality | 3.2 |
| Other services | 2.9 |
| Professional/ business services | 2.8 |
| Education and health services | 1.6 |
| Information | 1.5 |
| Financial services | 0.8 |
Source: Bureau of Transportation Statistics, Industry Snapshots: Uses of Transportation
Table 3. In-House vs. For-Hire Transportation by Sector 2014
($billions)
| In-House | For Hire | Total | In-House % | For Hire % | |
|---|---|---|---|---|---|
| Wholesale/Retail | 156.5 | 135.7 | 292.2 | 53.6% | 46.4% |
| Services | 114.1 | 150.7 | 264.8 | 43.1% | 56.9% |
| Government | 92.5 | 60.3 | 152.8 | 60.5% | 39.5% |
| Manufacturing | 62.5 | 161.4 | 223.9 | 27.9% | 72.1% |
| Construction | 27.6 | 21.3 | 48.9 | 56.4% | 43.6% |
| Natural Resources | 20.0 | 27.4 | 47.4 | 42.2% | 57.8% |
| Utilities | 0.9 | 18.3 | 19.2 | 4.7% | 95.3% |
Source: Bureau of Transportation Statistics, Industry Snapshots: Uses of Transportation


