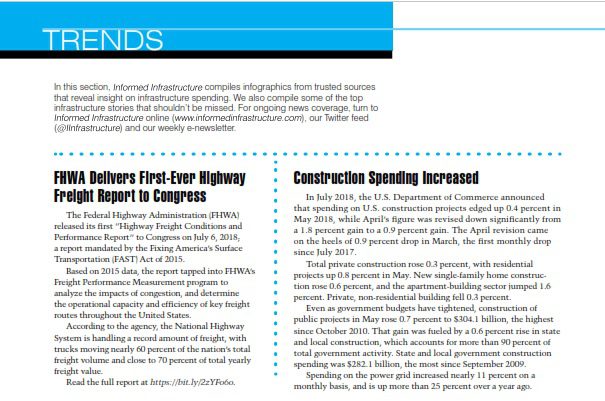
FHWA Delivers First-Ever Highway Freight Report to Congress
The Federal Highway Administration (FHWA) released its first “Highway Freight Conditions and Performance Report” to Congress on July 6, 2018; a report mandated by the Fixing America’s Surface Transportation (FAST) Act of 2015.
Based on 2015 data, the report tapped into FHWA’s Freight Performance Measurement program to analyze the impacts of congestion, and determine the operational capacity and efficiency of key freight routes throughout the United States.
According to the agency, the National Highway System is handling a record amount of freight, with trucks moving nearly 60 percent of the nation’s total freight volume and close to 70 percent of total yearly freight value.
Read the full report at https://bit.ly/2zYFo6o.
Construction Spending Increased
In July 2018, the U.S. Department of Commerce announced that spending on U.S. construction projects edged up 0.4 percent in May 2018, while April’s figure was revised down significantly from a 1.8 percent gain to a 0.9 percent gain. The April revision came on the heels of 0.9 percent drop in March, the first monthly drop since July 2017.
Total private construction rose 0.3 percent, with residential projects up 0.8 percent in May. New single-family home construction rose 0.6 percent, and the apartment-building sector jumped 1.6 percent. Private, non-residential building fell 0.3 percent.
Even as government budgets have tightened, construction of public projects in May rose 0.7 percent to $304.1 billion, the highest since October 2010. That gain was fueled by a 0.6 percent rise in state and local construction, which accounts for more than 90 percent of total government activity. State and local government construction spending was $282.1 billion, the most since September 2009.
Spending on the power grid increased nearly 11 percent on a monthly basis, and is up more than 25 percent over a year ago.
TOP Stories
The following are the top stories from the last few months (in terms of traffic) on the Informed Infrastructure website. This also reflects key coverage areas that are regularly refreshed online and via our weekly e-newsletter. Simply search key words on Informed Infrastructure online to find the full story.
Buildings
• Construction Complete on Northwest High Magnet School Additions, Renovations
• High-Strength Concrete Developed at MSU Could Save State Money, Time
• AISI Publishes New Report on Thermal Analysis of CFS Wall Assemblies
• Urban Land Institute Report Proposes Ten Principles for Building Resilience
• Cement Companies Must More Than Double Efforts to Meet Paris Climate Goals
Water
• Tracking Wastewater’s Path to Wells, Groundwater
• CULTEC and Armtec Sign Exclusive Agreement
• Nutrient Recovery Systems Market to Grow at 20% Until 2022
Transportation
• House Passes Two Rail Data Security Bills
• APTA Study: Poor Transit Infrastructure Leads to Negative Economic Effects
• Hawaii DOT Continues to Deal with Volcano-Related Disruptions
Tools and Technology
• Video: Drone with Ground Penetrating Radar (GPR)
• Vectorworks Inc. Announces Chinese Language Version of Vectorworks 2018 Software
• Eiffel Tower Grand Site Unveiled in 3D for the First Time Thanks to BIM
• FARO Introduces CAM2 2018 3D Measurement Software Platform
• What’s New in InfraWorks and Civil 3D 2019

Parul Dubey
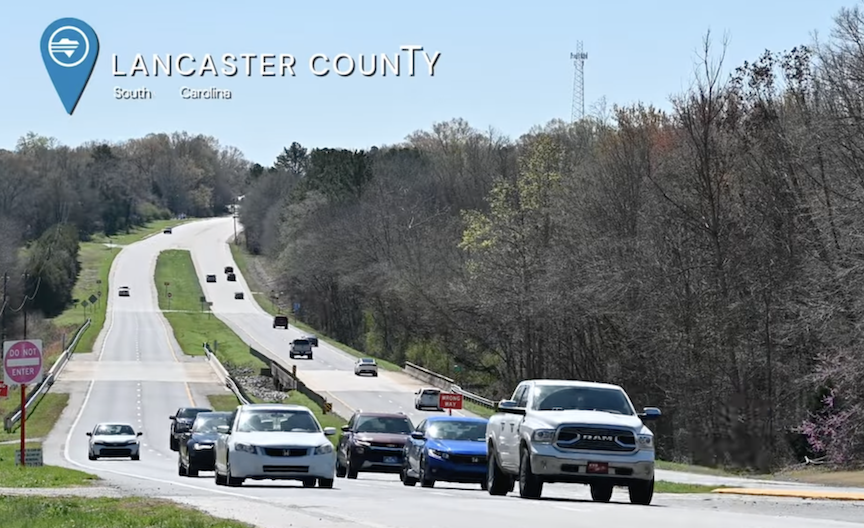
Video: Crashes Drop Measurably After Rural Road Safety Improvement Project on US 521 in Lancaster County
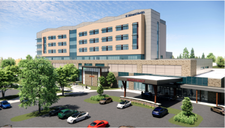
AdventHealth Weaverville Hospital
June Issue 2026
.jpg?width=225)