47,000 U.S. Bridges in Poor Condition, Pace of Repair Slows to Crawl
The American Road & Transportation Builders Association (ARTBA) analysis of the recently released U.S. Department of Transportation 2018 National Bridge Inventory (NBI) database reveals 47,052 bridges are classified as structurally deficient and in poor condition.
Cars, trucks and school buses cross these compromised structures 178 million times every day, the data show. Nearly 1,775 are on the Interstate Highway System.
Although the number of structurally deficient bridges is down slightly compared to 2017, the pace of improvement has slowed to the lowest point since ARTBA began compiling this report five years ago.
“At the current pace, it would take more than 80 years to replace or repair the nation’s structurally deficient bridges,” said Dr. Alison Premo Black, the ARTBA chief economist who conducted the analysis.
State-specific information from the analysis is available at www.artbabridgereport.org.
Renewable Energy Now Accounts for a Third of Global Power Capacity
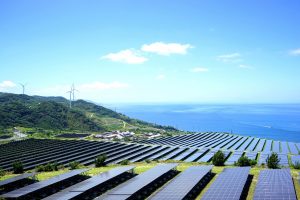 The decade-long trend of strong growth in renewable energy capacity continued in 2018 with global additions of 171 gigawatts (GW), according to new data released by the International Renewable Energy Agency (IRENA). The annual increase of 7.9 percent was bolstered by new additions from solar and wind energy, which accounted for 84 percent of the growth. A third of global power capacity now is based on renewable energy.
IRENA’s annual “Renewable Capacity Statistics 2019” report (available at www.irena.org/publications/2019/Mar/Capacity-Statistics-2019) indicates growth in all regions of the world, although at varying speeds. While Asia accounted for 61 percent of total new renewable energy installations and grew installed renewables capacity by 11.4 percent, growth was fastest in Oceania, which witnessed a 17.7 percent rise in 2018. Africa’s 8.4 percent growth put it in third place just behind Asia. Nearly two-thirds of all new power generation capacity added in 2018 was from renewables, led by emerging and developing economies.
TOP Stories
The following are the top stories from the last few months (in terms of traffic) on the Informed Infrastructure website. This also reflects key coverage areas that are regularly refreshed online and via our weekly e-newsletter.
Buildings
- Video: A Look Inside a Major Seismic Retrofit
- Boulder Valley School District Hosts Grand Opening for New Transportation Center
- Cintec Technology Aids in Restoration of Award-Winning 12th Century Castle
- Healthy Home Builder Duo Pioneers Construction Best Practices
- Dynamic Energy Partners with Barrette Outdoor Living to Bring Solar to Galloway Facility
Transportation
- U.S. Department of Transportation Announces $705.7 Million in Emergency Relief for Road and Bridge Repairs
- Acrow Modular Bridge Maintains Passage of Residential and Commercial Traffic in Port-au-Prince, Haiti
- Michigan DOT I-94 Bridge Team Honored with Award
- Pennsylvania Revives Long-Idled Rural Highway Project
- Woolpert, ODNR Win Award for ‘Indiana Jones’ Bridge in Hocking Hills State Park
Water
- AQUAOSO Announces Programmatic Assistance with Water Data Program
- New Color of CULTEC Chambers Has Added Benefits
- Ferrate Solutions, LLC Enters Global Market for Commercial Water & Wastewater Treatment
- Stantec Awarded Comprehensive Wastewater Project
- Sanexen Water's Innovative and Green Aqua-Pipe Technology Used to Upgrade Water main Pipe near Gillette Stadium in Countdown to the Big Game
Tools and Technology
- Virtual Surveyor 6.2 Now Processes Larger Drone Survey Projects
- NHBC Equips Building Inspectors with Rugged Panasonic Tablets
- Leica Geosystems, SVAB Integrate Machine Control Solutions with Tool Recognition for Excavators, Wheel Loaders
- Woolpert Earns Lidar Leader Award for Outstanding Enterprise Achievement
- FLIR Launches Industry-First High-Definition Handheld Cooled Optical Gas Imaging Camera for Oil and Gas Inspection Professionals

Parul Dubey
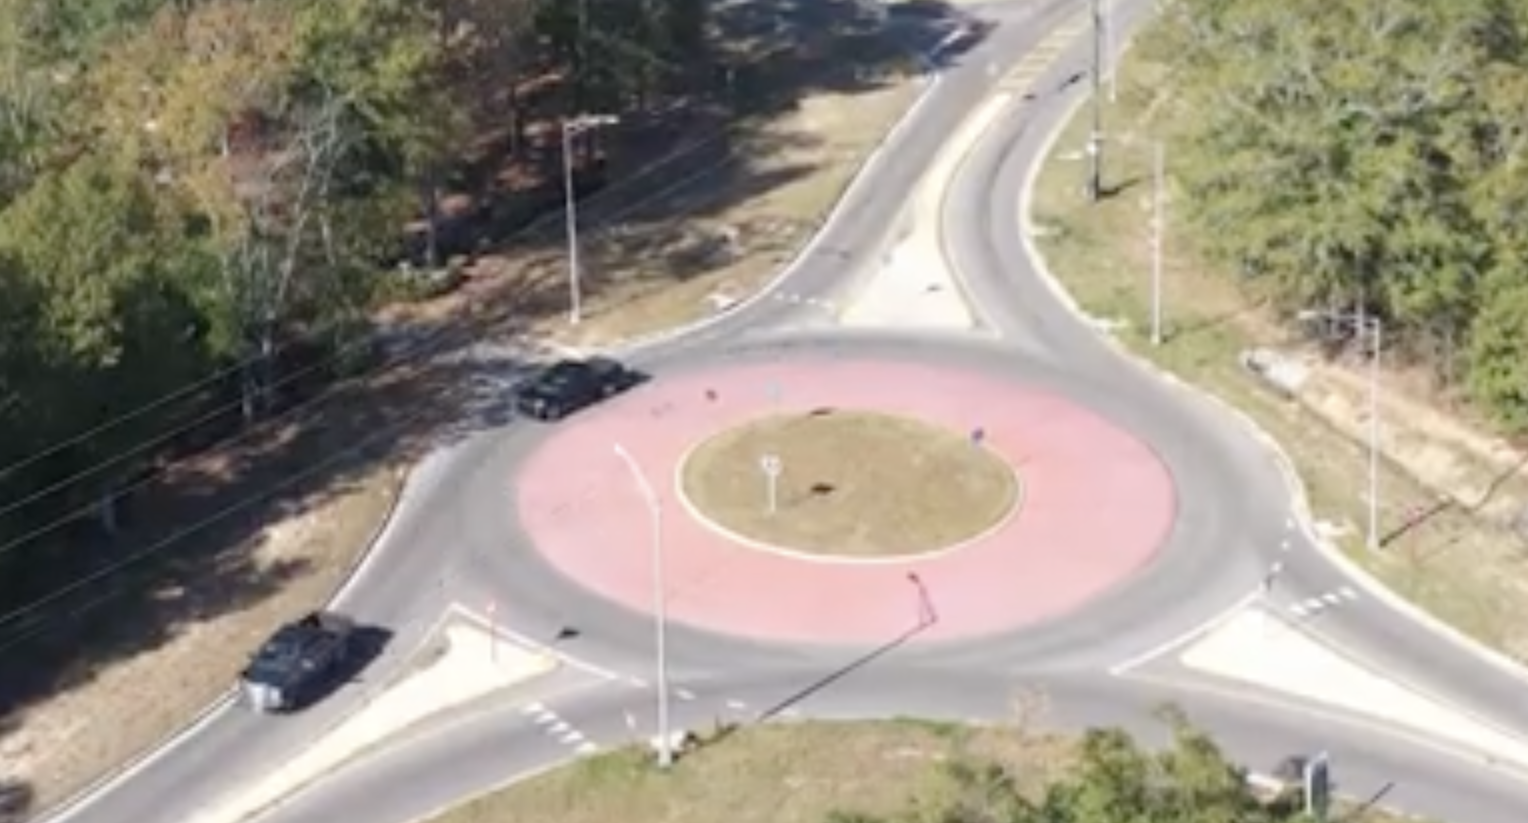
Video: New Roundabout Under Construction at McIver and Old Florence Roads in Darlington County
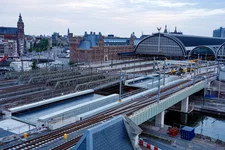
Bridge Replacement at Amsterdam Centraal Station
June Issue 2026
.jpg?width=225)