.jpg)
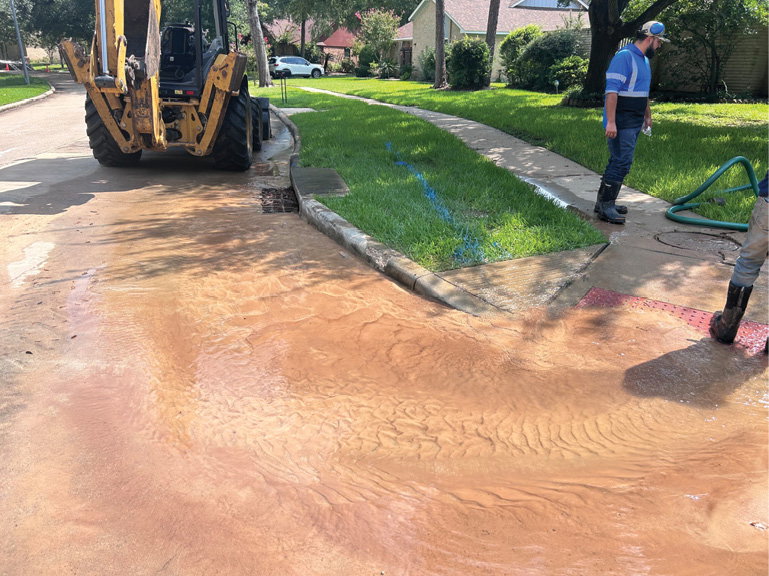
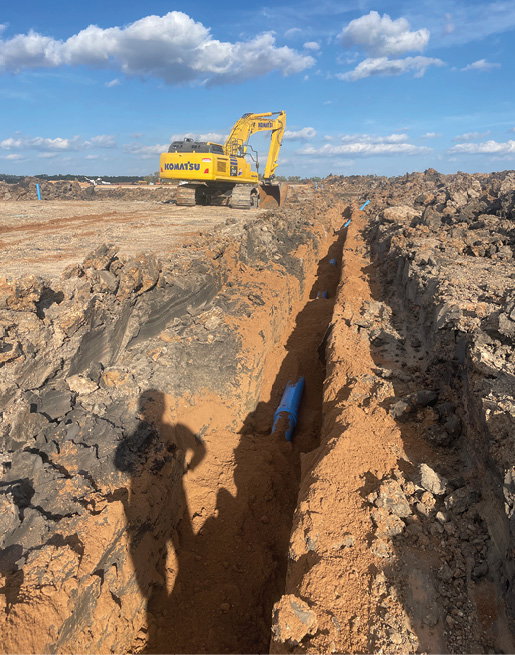
The Sugar Land GIS model (above) flagged this pipe segment as a high-priority location with a predicted failure probability of 0.98. The model proved correct, as a break occurred exactly where forecasted in September 2025, shown here during field response.
The Sugar Land GIS model (inset) flagged this pipe segment as a high-priority location with a predicted failure probability of 0.98. The model proved correct, as a break occurred exactly where forecasted in September 2025, shown here during field response.
unicipal asset management is one of the most researched topics in civil engineering. Probabilistic deterioration models, survival analysis, machine-learning forecasting and risk-based integrated planning frameworks all are well documented in journals, guidance documents and vendor platforms.
Yet inside most cities, capital replacement decisions still are driven by simple condition scores, linear life assumptions and reactive replacements. The barrier isn’t a lack of analytical tools—it’s council defensibility, budget-cycle pressure and organizational capacity. If a method can’t survive a 10-minute council explanation, it won’t survive a fiscal year. In municipal practice, the question rarely is “what’s the best model?”; it’s “what’s the next step we can defend, fund and repeat?”
Across North America, audits and maturity assessments show the same pattern: asset-management plans exist but are not consistently used; data are fragmented; and staff capacity is thin. The gap between theory and practice therefore isn’t a technical problem—it’s a structural one rooted in governance, data maturity and risk appetite.
This article presents a practical maturity ladder for municipal asset management, grounded in field experience and supported by documented evidence. The goal isn’t to push cities toward the highest theoretical rung, but to help engineers, managers and decision-makers identify the next realistic step their organization can sustain.
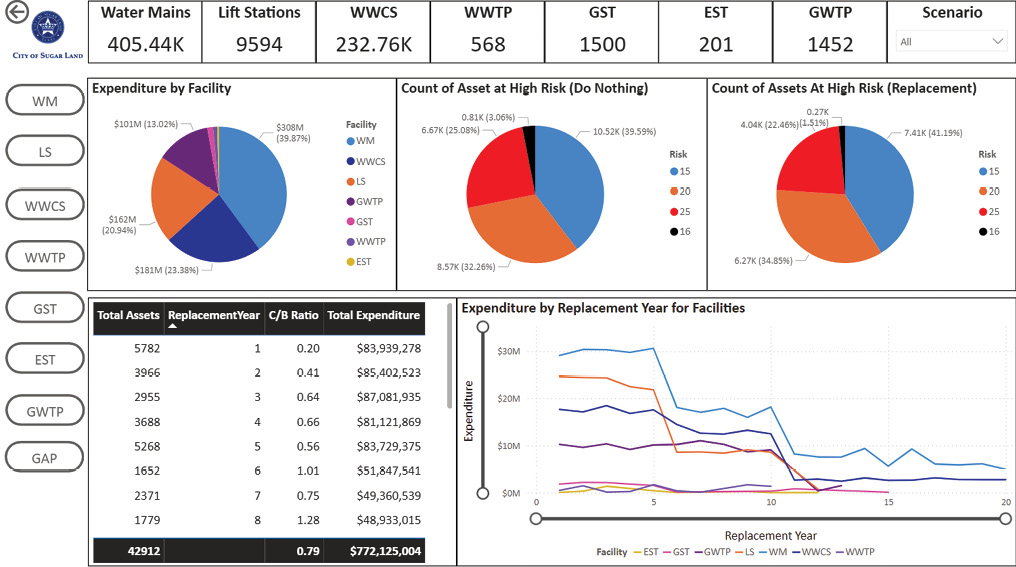
The City of Sugar Land risk-based cross-asset management dashboard displays a conceptual aggregated output used for multi-year scenario modeling and prioritization. Actual conditions in the field may differ unless the correct filters and layers are applied to reflect the current system state.
Why the Gap Persists
Across North America, audits, surveys and maturity assessments repeatedly identify the same pattern:
• Asset-management plans exist but aren’t actively used to guide replacement decisions.
• Asset data are fragmented across departments and systems.
• Staff capacity for analysis is limited.
• Political and budget cycles misalign with pilots and long-term research efforts.
The gap between theory and practice therefore isn’t primarily a software problem or a math problem; it’s a structural problem rooted in data maturity, governance and organizational risk appetite.
Table 1 summarizes documented field evidence that mirrors what many municipal engineers experience daily and reinforces why traditional maturity models often fail to reflect real operating conditions.
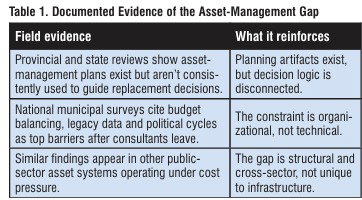
These findings reinforce a simple conclusion: maturity models that assume stable data, consistent funding and tolerance for experimentation don’t reflect the operating reality of most cities.
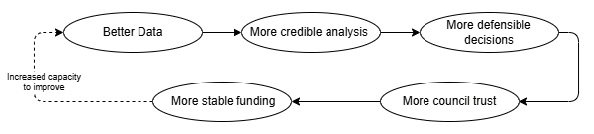
Figure 1. Reinforcing Asset-Management Loop. How improvement in data quality improves analysis credibility, leading to more defensible decisions, greater council trust and more stable funding through time.
A Reinforcing Loop, Not a Checklist
Asset-management maturity isn’t a checklist; it’s a reinforcing loop. Figure 1 illustrates the core cycle that governs municipal decision-making.
Improvements in data quality reinforce analysis credibility, which enables defensible decisions, builds council trust and stabilizes funding through time.
• Better asset data leads to more credible analysis.
• More credible analysis supports more defensible decisions.
• Defensible decisions build council trust.
• Council trust enables more stable funding.
• Stable funding increases capacity to improve data (closing the loop).
Each step on the maturity ladder participates in this same loop at a different entry point.
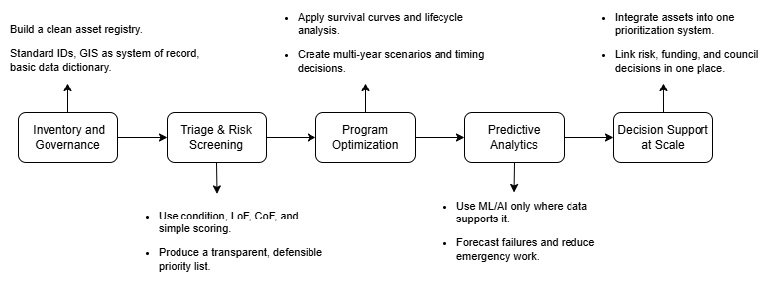
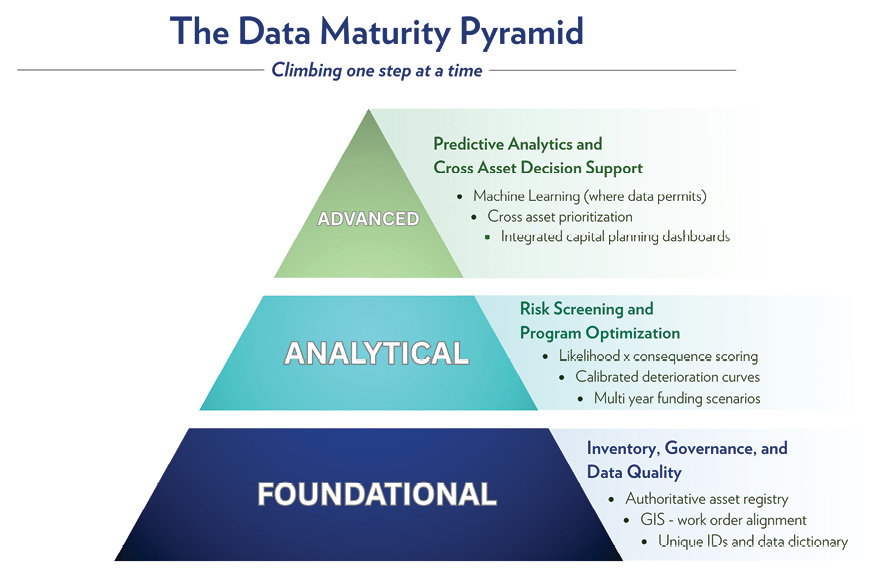
Figure 2. Asset-Management Maturity Ladder. Five practical steps that build on each other, from basic condition data to integrated cross-asset decision support.
The Asset-Management Maturity Ladder
Figure 2 presents a five-step ladder that reflects how asset management actually evolves inside municipalities.
Five practical steps build sequentially from basic inventory control to integrated cross-asset decision support:
1. Inventory and governance.
2. Triage and risk screening.
3. Program optimization using deterioration or survival models.
4. Predictive analytics where data permits.
5. Decision support at scale across asset classes.
Each step increases analytical sophistication and organizational demand.
Industry Context
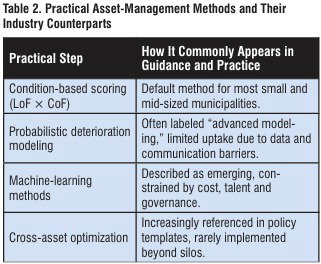
To help practitioners map this ladder to commonly referenced methods and guidance, Table 2 aligns each step with how it typically appears in practice.
Step 1. Inventory and Governance
The foundation of every asset-management system is a reliable inventory and clear ownership of the data.
What it looks like:
• A single authoritative asset registry
• GIS linked to work orders and financial systems
• Unique asset IDs and a short, enforced data dictionary
Typical failure mode:
• GIS and work orders drift apart
• “Shadow spreadsheets” become the real system
Exit test: Finance can produce a replacement-cost table that matches the fixed-asset ledger within an agreed tolerance. If a city isn’t here, no advanced model will hold.
Step 2. Triage and Risk Screening
Once the inventory is stable, cities can begin prioritizing assets using simple, transparent risk logic.
What it looks like:
• Basic likelihood-of-failure and consequence-of-failure scoring
• Published scoring matrices
• Plain-language explanations in council packets
Typical failure mode:
• Risk inflation
• Everything labeled “high risk”
Exit test: The top 10 percent of ranked assets account for a clear majority of next year’s CIP funding, and rankings shift logically when new data arrive. Most small and midsized cities operate at this level. That isn’t a failure; it’s a starting point.
A capital-improvement segment identified through Step 3 program modeling illustrates how predictive tools guide future renewal projects.
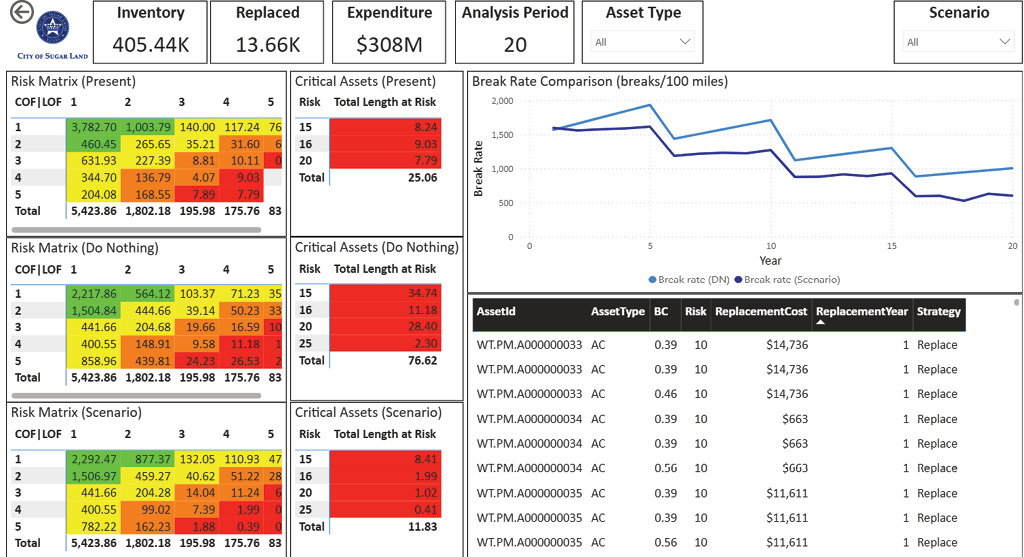
Multi-year scenario modeling and risk-based prioritization for watermains are used to guide capital planning decisions.
Step 3. Program Optimization
With risk screening in place, cities can begin exploring multi-year planning and scenario analysis.
What it looks like:
• Survival or deterioration curves where sufficient history exists
• Periodic calibration
• Confidence bands shown on forecasts
Typical failure mode:
• Curves copied from other cities or literature and never recalibrated
Exit test: Multiple multi-year funding scenarios are presented alongside the annual budget, showing tradeoffs between risk and cost. At this step, asset management becomes a planning tool rather than a ranking exercise.
Step 4. Predictive Analytics
Predictive methods add value only when data maturity and governance can support them.
What it looks like:
• Machine learning used only where labeled history supports it
• Human review before recommendations become projects
• Scheduled retraining and accuracy tracking
Typical failure mode:
• Blackbox models
• No monitoring after deployment
Exit test: Model performance metrics are tracked annually and remain stable or improving. This step is optional and not required for sound asset management.
Step 5. Decision Support at Scale
The highest level of maturity integrates data, risk and funding decisions across asset classes.
What it looks like:
• One capital-planning dashboard
• One prioritization logic across asset classes
• Clear audit trails linking budgets to asset IDs and risk scores
Typical failure mode:
• Departmental resistance
• Undocumented cross-asset logic
Exit test: Council can trace any CIP project to a specific asset, risk score and rationale. At this stage, asset management becomes a governance tool, not just an engineering one.
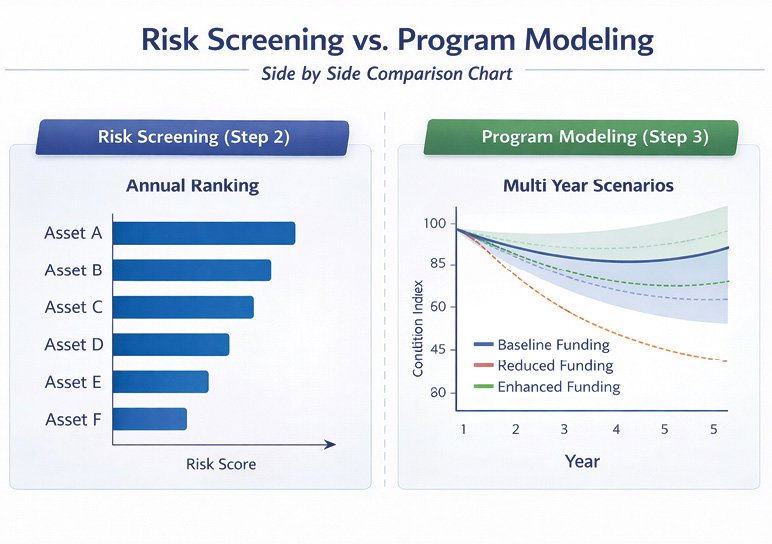
Risk screening ranks assets for a single year, while program modeling evaluates multi-year funding scenarios and risk tradeoffs.
Advanced analytics rest on a foundation of inventory accuracy, governance and risk-based program modeling. Cities progress upward as data quality and capacity increase
A Shift Observed in Practice
In the City of Sugar Land, Texas, moving from simple risk screening to calibrated program modeling shifted several million dollars of planned bond funding toward higher-risk water mains. An external audit validated the change. Council discussions focused on dollars and risk reduction, not on the mathematics behind the models.
That experience reinforced a core lesson: the goal isn’t analytical elegance. The goal is defensible, transparent decisions that withstand public scrutiny.
What Engineers Can Do Next
Climbing one step on the maturity ladder doesn’t require a new platform or a major initiative. Small, deliberate actions compound through time:
• Export the asset registry and identify missing fields.
• Target the smallest fixable data gap this quarter.
• Be explicit about uncertainty rather than hiding it.
Incremental improvements feed the same reinforcing loop as advanced models. Better data leads to better decisions, which builds trust that increases capacity for the next improvement.
Alence Poudel
Alence Poudel, P.E., is a senior engineering manager with the city of Sugar Land, Texas; email: [email protected].
Video: New Roundabout Under Construction at McIver and Old Florence Roads in Darlington County

Bridge Replacement at Amsterdam Centraal Station

June Issue 2026
.jpg?width=225)