How Broadband Mapping Drives Economic Development and Planning Initiatives
While an internet connection has become a daily fixture in the life of most Americans, lack of access to high-speed internet service, also known as broadband, is still putting portions of the country at a disadvantage. Connected Nation, a national non-profit based in Bowling Green, Kentucky, has been mapping broadband service areas for over a decade in an effort to close the digital divide. Working with states, communities, families, and individuals, Connected Nation assists in realizing the great economic and social advantages that are gained when broadband availability is accelerated in unserved areas and broadband use is increased in all areas – rural and urban alike.
Significant technology advances have occurred in telecommunications in the last few years, increasing mobile wireless availability, fiber to the home, and speeds across all internet platforms in general. However, there are still gaps in broadband access in the United States, especially in rural areas where the largest number of unserved and underserved households remains.
Currently, broadband service is defined as an internet connection with at least 768 Kbps download and 200 Kbps upload speeds, as presented by the National Telecommunications and Information Administration (NTIA); NTIA is managing the State Broadband Initiative (SBI) to gather, aggregate, and analyze broadband datasets collected by state entities for inclusion on the National Broadband Map (NBM). The Federal Communications Commission (FCC) has assisted with the creation and maintenance of the NBM and in 2010, published the National Broadband Plan, which defined broadband service as an internet connection of at least 4 Mbps download and 1 Mbps upload speeds.
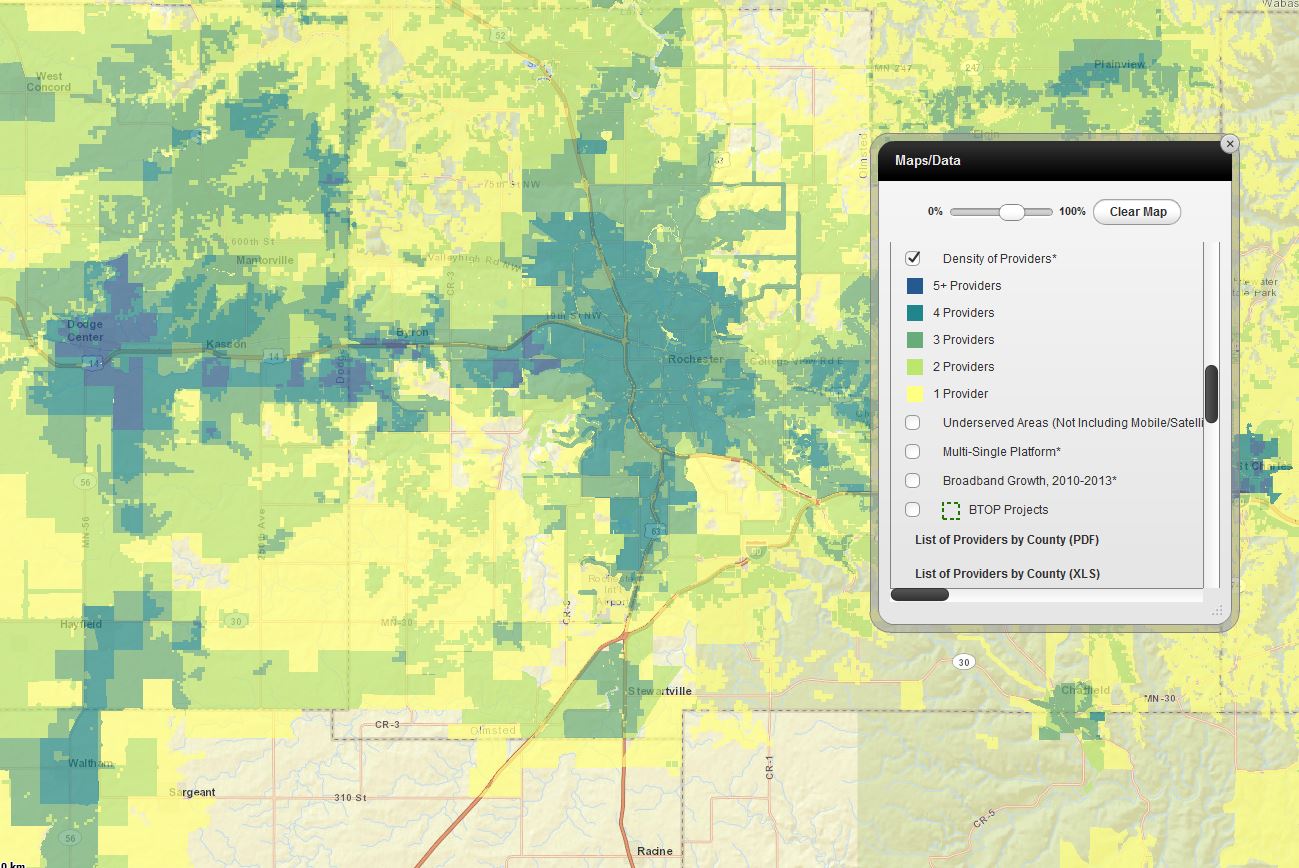
The density of providers analysis depicts the number of broadband service providers available in a given area, not including mobile wireless or satellite services; area displayed is around Rochester, MN.
Regardless of the chosen definition on broadband speeds, satisfaction with current internet, if available, can be quite subjective. For someone in an urban area who is accustomed to 10 Mbps speeds to view Flash-based websites and download files and forms quickly, a 768 Kbps connection would certainly not be desired, but then to a business or school that frequently has several individual connections to the network, even a 10 Mbps connection is not sufficient.
The SBI program is a five-year federal grant program that will continue through the fall of 2014 and has included semi-annual submissions of broadband datasets by each state and U.S. territory. The submitted data is aggregated to populate the National Broadband Map, available at www.broadbandmap.gov. When the National Broadband Map was first launched in February 2011, it became the first broadband service area web map built on a national scale. The information contained within the application continues to inform and impact federal policy, such as the Connect America Fund and other programs.
GIS provides states, broadband providers, and other stakeholders the opportunity to leverage the current broadband landscape against demographic information, develop network expansion plans, and spur economic development through broadband adoption.
Broadband Service Areas
Connected Nation (CN) is currently working on the data collection and analysis of broadband service inventories across nine states and one U.S. territory as part of the SBI program. While broadband data can be collected and analyzed from several sources, CN begins data collection by working directly with all known broadband providers. Since not every company has GIS resources to produce datasets that fit within the requirements of the SBI program, CN remains as flexible as possible in the data collection process; data formats received for processing have included everything from shapefiles to essentially a drawing on the back of a napkin. Working with providers on the information they may already have available can help facilitate or encourage participation in this voluntary federal program.
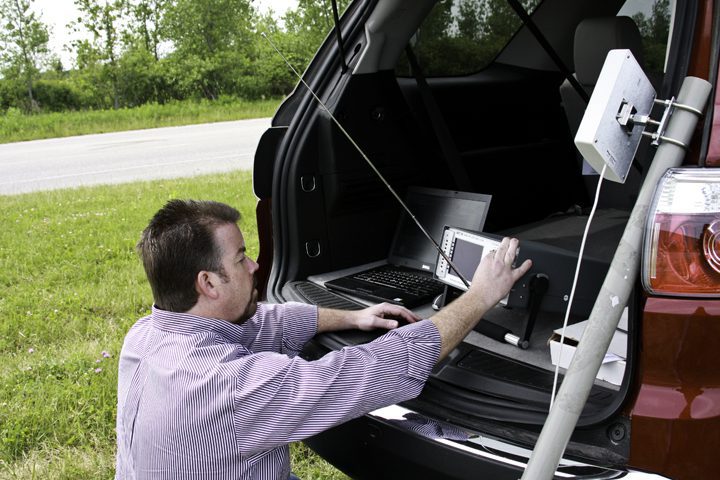
Daryl Coffey of the Engineering and Technical Services (ETS) staff completes field validation in Michigan.
After data is collected, processed, and approved by the broadband provider, static maps and interactive mapping applications (see Data Visualization section) are updated with the aggregated broadband data for public consumption. Getting this information out into the public space has generated significant feedback from local consumers who are able to confirm the accuracy of information displayed on the maps or provide details on areas where discrepancies exist. This crowdsourced dataset, referred to as broadband inquiries, allows Connected Nation to make revisions to broadband service areas in conjunction with service providers to create a more accurate depiction of where coverage is and is not available. In addition, the consumer information is compiled to show service providers where there is a demand for broadband coverage that can assist providers in developing expansion plans.
Field validation is another way that CN verifies the presence of broadband services, through the work of its Engineering and Technical Services (ETS) staff. In addition to desktop research prior to going out into the field, the ETS staff conducts spectrum analyzer studies on wireless services, locates and documents physical wireline attributes such as central offices and CATV plant, and conducts mobile wireless speed tests using provider-specific aircards and smart phones, among other validation techniques. This type of field work also assists in the estimation of broadband service areas for providers that are unable or unwilling to participate in the SBI program. Having the most complete depiction of broadband service areas mapped has assisted in identifying unserved and underserved areas in need of expansion, while attempting to not overbuild into areas that already have providers present.
Data Visualization
With the large amount of broadband data being gathered, there are several analyzes and data visualization tools that can be developed to further assist stakeholders in understanding the current broadband landscape and planning expansion activities. Sometimes, especially with smaller fixed wireless broadband providers, the model propagations created based on equipment standards, frequencies used, and local topography can represent the first time the provider has seen what the extent of their service area by tower actually looks like. On several occasions, the provider has added this coverage map to their website and uses it to determine the need for site surveys at a potential customer’s address, saving the company time and money.
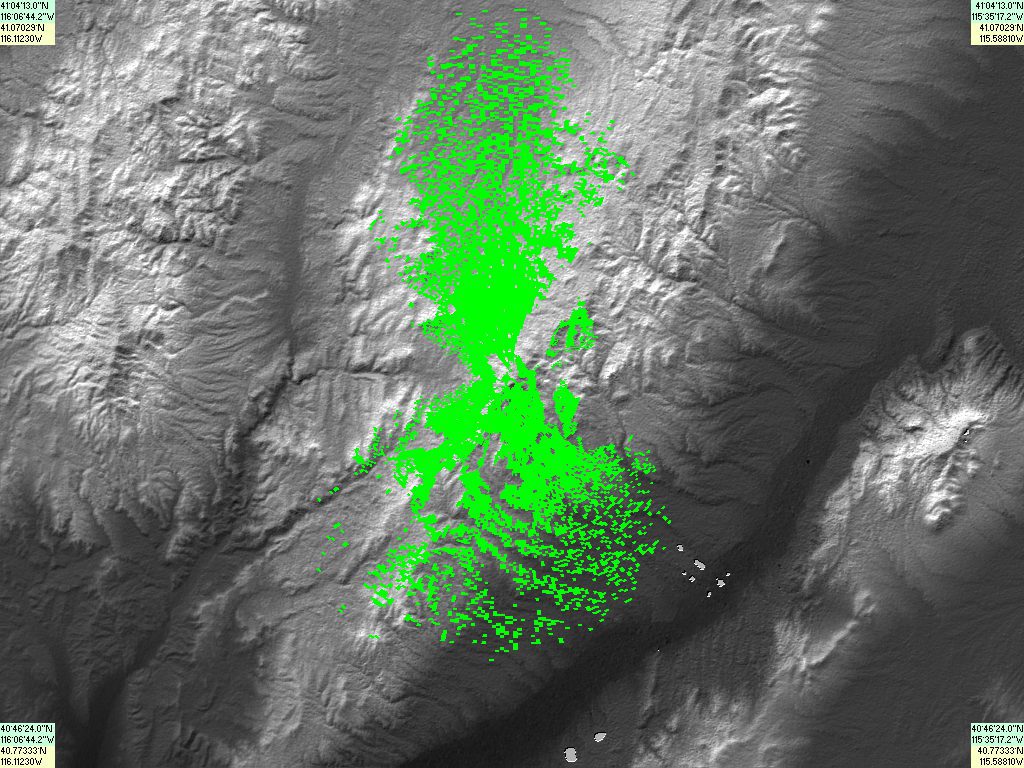
Model propagations are developed to estimate coverage areas of fixed wireless signals, based on tower height, equipment used, and surrounding topography; area displayed is around Elko, NV.
Connected Nation produces several maps and analyses based on the information gathered and processed as part of the SBI program, including broadband availability by technology type, maximum residential download speed, and density of unserved households by census block. These products allow various stakeholder groups the opportunity to visualize where current services are available at various speeds, as well as – and perhaps more importantly – where high-speed internet service is still not available. GIS allows for powerful analyses to be completed, taking into account the broadband coverage and the underlying demographic information to determine areas of high demand in unserved areas and assist in the development of expansion plans.
In addition to the static maps created, each state’s interactive mapping application is updated with the most recent broadband datasets and analyses. Called My ConnectViewTM, these web maps allow policymakers, broadband providers, stakeholders, and the general public to explore the various broadband data layers, additional analyses, vertical assets, and much more. Of course, the first thing a new user likely wants to do on the map is find their house; a locate tool will zoom to the entered address and provide a list of the broadband providers that are available at that location. Beyond that initial functionality is a host of tools and data layers to create customized views of the broadband landscape based on the needs of the user.
Analyses published on My ConnectView include the density of broadband providers, underserved areas, and broadband growth from 2010-2013. Where available, county-level research results on broadband adoption and computer ownership are included on the web map that can be used as an overlay to broadband connectivity data to draw conclusions between access and adoption of services.
One of the most popular items on the web maps is a tool that allows users to obtain demographics on served and unserved households by census block; broadband providers and those in economic development use this tool to define high priority areas for expansion. The tool works by returning availability analysis results based on an area drawn on the map by the user, highlighting the selected census blocks and displaying a table of those block IDs, the number of served and unserved households, and the rural classification. The results table can be exported to a .csv file that can then be used in internal analyses by the organization and in grant/loan applications where census block IDs are a requirement.
Users can also download some of the broadband datasets as submitted to the NTIA for the SBI program, using the extract tool to specify an area of interest, make dataset selections, and specify the format of the data export to spreadsheet, PDF, shapefile, or geodatabase. In the top menu bar of the application, My ConnectViewTM includes options for users to e-mail and print screenshots of the current map view or copy and send a link of the current map view to another user, who can then open the map at the same zoom level with the same data layers displayed. Additional enhancements, tools, and data layers are in development to increase the functionality of the application.
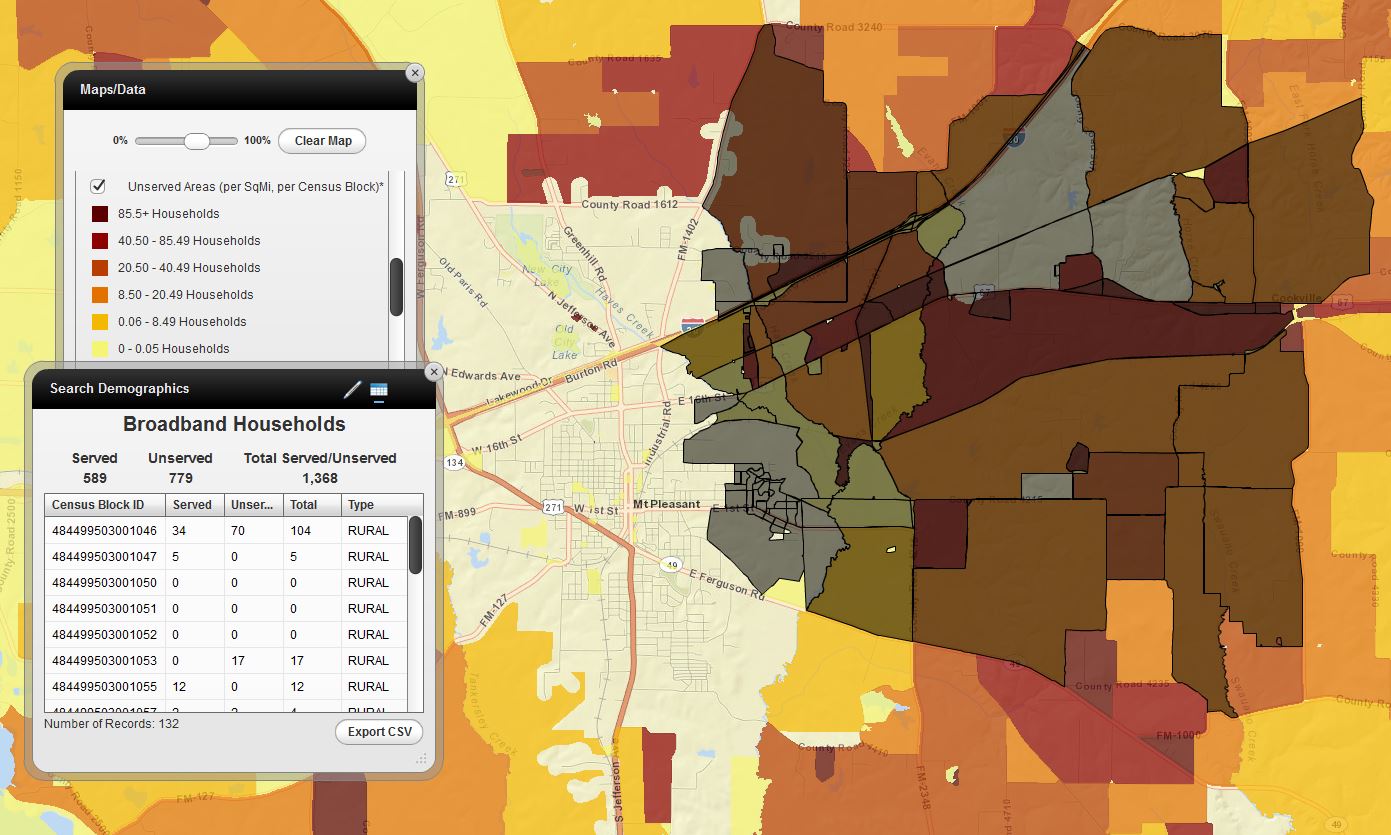
The search demographics tool provides users with broadband demographics at the census block level; area displayed is around Mount Pleasant, TX.
Connected Community Engagement
Deploying broadband infrastructure, services, and applications, as well as supporting the universal adoption and meaningful use of broadband, are challenging but required building blocks of a twenty-first century community. In 2012, Connected Nation launched the ConnectedSM Community Engagement Program to help communities assess local broadband access, adoption, and use, and develop an action plan for pursuing solutions.
As an extension of the broadband data collection for the SBI program, various patterns in availability have become apparent, but there are still marked differences between local communities. Obviously, the same approach to expanding broadband access, adoption, and use across all communities is not viable, so Connected Nation works with interested communities to assess where they are, where they want to be, and how their community can get there with the ConnectedSM program.
Broadband is an economic driver in today’s workplace, creating job opportunities and telework options for those who have access at home, in addition to attracting new businesses to the area. Assessing the local broadband landscape empowers community leaders to make more informed decisions and develop a community action plan for overcoming local technology gaps.
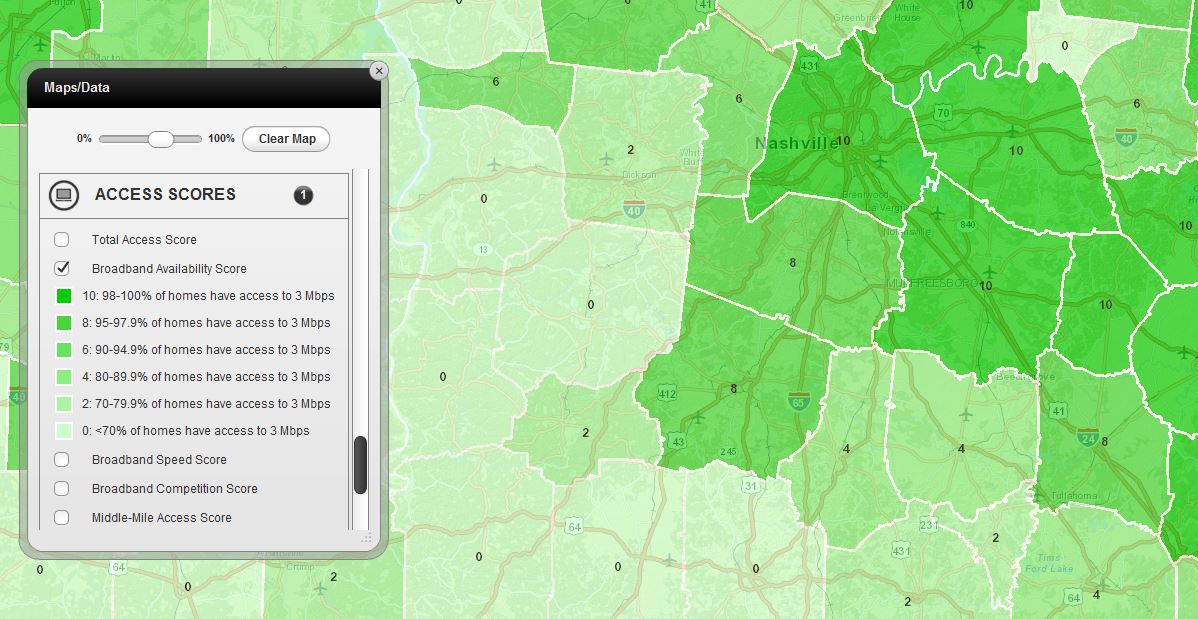
The ConnectedSM Community Engagement Program analyzes various broadband access statistics to assess the connectivity of local communities; area displayed is around Nashville, TN.
While assessing local broadband access, adoption, and use, communities can promote their connectivity status through the Connected Certified Community program, a nationally recognized platform for spotlighting communities that excel in these three areas. The assessment measures 13 indicators of access, adoption, and use, including broadband speeds, digital literacy, and educational applications.
GIS becomes an advantageous part of the ConnectedSM program, as broadband availability can be analyzed at the local level to provide comparative scoring across a state. After each semi-annual SBI data collection is submitted, custom geoprocessing analyses are completed for the ConnectedSM program, assessing broadband availability, broadband speeds, broadband competition, middle-mile access, and mobile broadband availability. These scores are assessed at a county level and are each displayed on My ConnectViewTM, under the Access Scores section, so that patterns can be determined and additional comparisons can be made.
Without GIS, these spatial analyses would be nearly impossible to complete. The power of GIS is in being able to provide data visualization solutions that allow the vast number of broadband stakeholders the opportunity to better understand the current broadband landscape to make more informed decisions on expansion and getting all citizens connected. Getting all Americans connected to high-speed internet continues to be a profound undertaking, but every great journey begins with a map. To learn more about Connected Nation programs and GIS Services, visit www.connectednation.org.
About Ashley Hitt
Ashley Littell Hitt is the Director of GIS Services at Connected Nation, developing strategies using GIS to provide data visualization solutions that impact policy, economic development, and the digital divide. Ashley received a Master’s degree in Geoscience and a Bachelor’s degree in Geography (Meteorology emphasis), both from Western Kentucky University. She is also a certified GISP and is currently on the Board of Directors of URISA, the Association for GIS Professionals.