Golden Software Enhances Grapher Package with Faster Run Times and Improved Functionality Across Plot Types
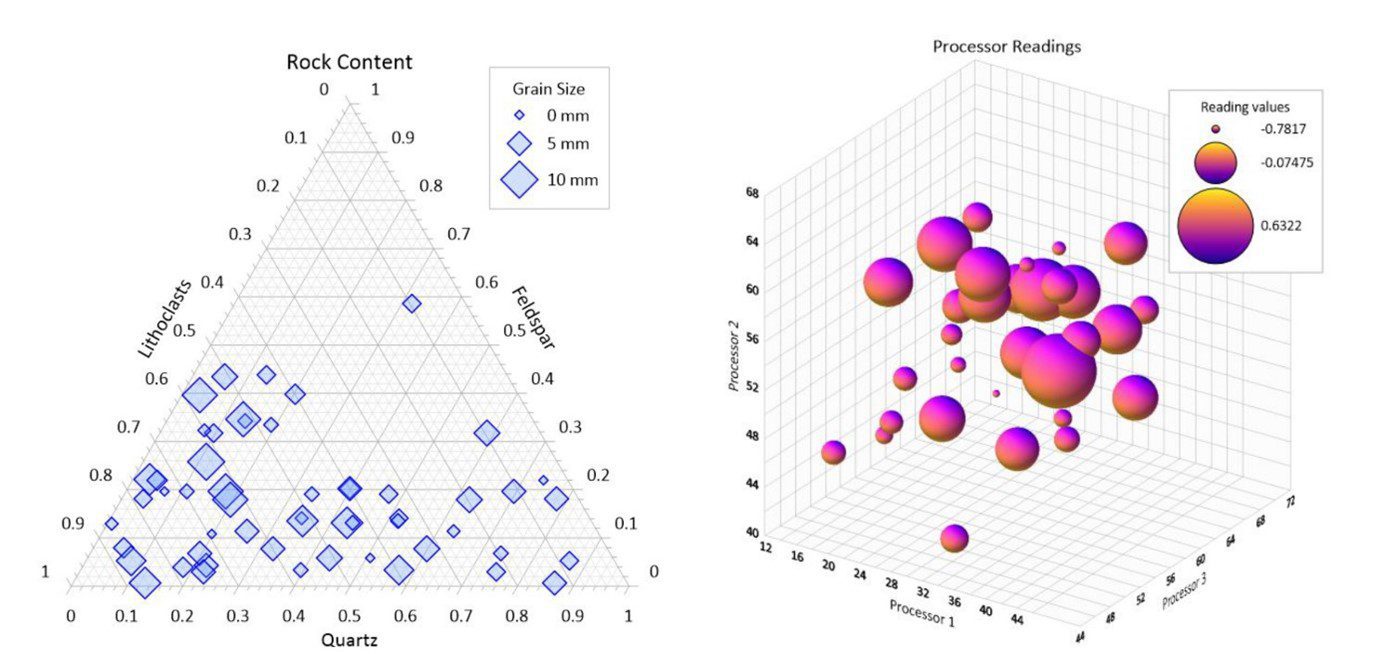
Add a legend showing proportional bubble sizes to your Ternary, 2D or 3D Bubble Plots
Grapher Beta Also Available
GOLDEN, Colorado – Golden Software, a developer of affordable software for visualizing and analyzing diverse data sets, has announced significant upgrades to its scientific graphing package, Grapher™. The new version released today is faster and offers a broader, more consistent selection of features across all plot types.
“Grapher is now easier and more intuitive to use with numerous functions and capabilities standardized throughout the application,” said Justine Carstairs, Grapher Product Manager. “Users will also find the new version provides improved display features for better communication of information.”
Grapher is used extensively by scientists and engineers in oil & gas operations, environmental consulting, climate research, mineral exploration, and academic pursuits. The package offers deeper insights into diverse data sets, including chemical, physical, geologic and geospatial data, through 80 different 2D and 3D plotting types.
The newest release of Grapher, which is downloadable this week to all users with active maintenance agreements, includes these enhancements:
Bubble Plot Legend Addition – Ternary, 2D and 3D Bubble Plots are now easier for a viewer to interpret and understand thanks to Bubble Legends. Displayed in the same colors, gradients and shapes of the bubble, these legends describe the third variable that determines the size of the bubble.
Box Plot Improvements – Two enhancements have been made to Box Plots. The first is adjustable box widths for either manual resizing or to indicate the size of each sample set. Previously only available in one default width, the box width can be varied and shown in inches or percentages to correspond with the number of values in each sample. The second improvement is the addition of the Criteria Filter, which gives the user greater control over excluding or including data, such as unwanted outliers, in the plot.
Ternary Plot Improvements – The Criteria Filter described above has been added to Ternary Plots. A second important enhancement is the Clipping function which allows users to easily snip off data they do not want displayed in their Ternary Plot. As available in other plot types, Clipping can be applied at axes limits or by values.
File Open Dialog Enhancement – Users can now resize the File Open dialog for better, more complete viewing of their data paths, making it easier to navigate files.
Faster Run Times – Routine functions such as Copy/Paste and project file loading have been dramatically improved to run faster than before when projects are connected to large amounts of data.
Golden Software’s development team is already working on new features, functionality and enhancements for the next version of Grapher that will be released in late 2021. Users with active maintenance can take these new capabilities for a test drive by downloading Grapher Beta. They are invited to send comments and/or questions directly to the Golden Software development team as they use the Beta version in their day-to-day workflows.
“In the Beta version, we are continuing to build on our progress making Grapher more stable and easier to use,” said Carstairs.
Specifically, newest Grapher Beta features include:
- Data Filter is a flexible tool that gives users the ability to add multiple exclusion and inclusion filters – which can be combined with logic conditions or math functions – for precise control over what data will be plotted.
- Auto Disperse Label Tool eliminates cluttered plots that can come with closely clustered data points by automatically moving labels, so they do not overlap with one another.
- Class Plot Reordering enables the user to change the order in which text classes appear in the corresponding Class Legend.
- Percentage Label Option offers the option of labeling plots and axes in percentage format.
- Align and Distribute Objects to Margin controls the layout of graphs, text, shapes, and drawn objects by allowing the user to align or distribute the objects with the center or sides of the page.
- Improved Worksheet Manager automatically closes data files that are not being used or linked in the project to reduce clutter.
- Status Bar Update and Mouse Curser Position allows the user to see the mouse cursor position in graph units in the status bar at the bottom of the screen when a plot is selected. The graph units appear as the same units used on the plot axes, including when date/time format is used. The Status Bar sections are now also resizable.
- Digitize in Time/Date Format – Plot digitizing can now be captured in the Date/Time format of the plot axes (hours, minutes, seconds).
Details on Grapher Beta may be accessed here: What is Grapher Beta?.
About Golden Software
Founded in 1983, Golden Software is a leading developer of affordable scientific graphics software. Its customer base includes over 100,000 users involved in environmental consulting, oil and gas exploration and extraction, mining exploration and extraction, engineering, applied science, business, education, and government in nearly 190 countries and territories. Golden Software offers four products: Surfer® for gridding, contouring and 3D surface mapping; Grapher™ for 2D and 3D graphing; Voxler® for 3D data visualization; and Strater® for well log, borehole and cross section plotting.
For additional information, visit www.GoldenSoftware.com or call 1-303-279-1021.