
A summer home falls into Lake Michigan. (Image Courtesy: Patrica Gancer)
The home was built in 1890 and was buffered from Lake Michigan by more than an acre of wooded land. The Gancer family took possession of the cottage and land in 1930 and Patricia was a fifth-generation owner. During the next several decades, the lake relentlessly eroded the shoreline. The family was in the midst of efforts to forestall the collapse, including buttressing the shoreline with a revetment and making structural improvements to the home to counter the effects of the undermined foundations. Unfortunately, the lake won and took the house as spoils.
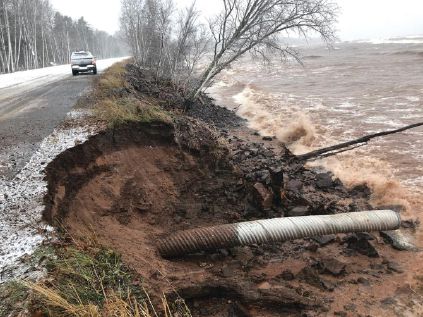
embankment in Michigan.(Image:Michigan DNR)
Hundreds of miles away in Upper Peninsula Michigan, an estimated $550,000 emergency repair on County Road 107 started in August 2019 where erosion from Lake Superior threatened the access road to the eastern side of the Porcupine Mountains.
“This shoreline protection project is an immediate-response effort intended to keep wave action and storms from further eroding or undermining the bridge or roadway that collectively serves as the eastern gateway to the park,” says Eric Cadeau with the Michigan Department of Natural Resources.
On Lake Superior in Duluth, Minn., from October 2017 to October 2018, roads, bike paths and seawalls were destroyed, and beaches and shorelines were eroded as three consecutive massive storms battered the area. By the time the assault subsided, the cost of the damage exceeded $30 million and impacted thousands of people in the area.
In May 2020, at the northern “tip of the mitt” in Emmet County, Mich., local officials reminded residents to diligently maintain their septic fields to prevent sickness. As high water tables rise, septic systems that rely on the surrounding soil to properly filter sewage become compromised and threaten to contaminate groundwater drinking water. Rising water tables and flooding also increased the leakage risk of chemicals and fuel from flooded basements into groundwater and drinking water wells.
Across the Great Lakes region—from Minnesota to New York and Ontario to Ohio—local, state and federal agencies have declared states of emergency, executed emergency repairs, and issued hundreds of warnings related to severe weather events associated with rising lake levels. In fact, the U.S. National Weather Service issued more than 400 Great Lakes lakeshore flood warnings and advisories from January 2019 through early May 2020.
What’s causing all this damage and mayhem, and why? A lot has to do with the water levels of the lakes. Precipitation and lake levels in the region rise and fall on cyclical intervals, with periods of excess dryness or wetness persisting for up to several years. The rise and fall, along with typical wave action, results in a natural shoreline erosion of about 1 foot per year, but something else is going on here.
The Great Lakes
The Great Lakes include Lakes Superior, Michigan and Huron (which are hydraulically connected and studied as a single system), Ontario, and Erie. Along with Lake St. Claire, sometimes referred to as the “sixth Great Lake,” the lakes are the largest system of fresh surface water in the world. Approximately 34 million people live in the Great Lakes region, accounting for about 8 percent of the U.S. population and 32 percent of the Candaian population. To the millions in the region—and millions more beyond—the lakes are relied upon for fresh drinking water, recreation, fisheries, transportation, industry and commerce. The lakes are the foundation for $16 billion of tourism and $7 billion of industrial economic activity annually.
Due to their regional and national importance, the lakes are extensively studied, monitored and attended to by a wide variety of government agencies, universities and private organizations, including the U.S. Army Corp of Engineers (USACE), the National Oceanic and Atmospheric Administration (NOAA), the Great Lakes Environmental Research Laboratory (GLERL), the Tip of the Mitt Water Council, and many others.
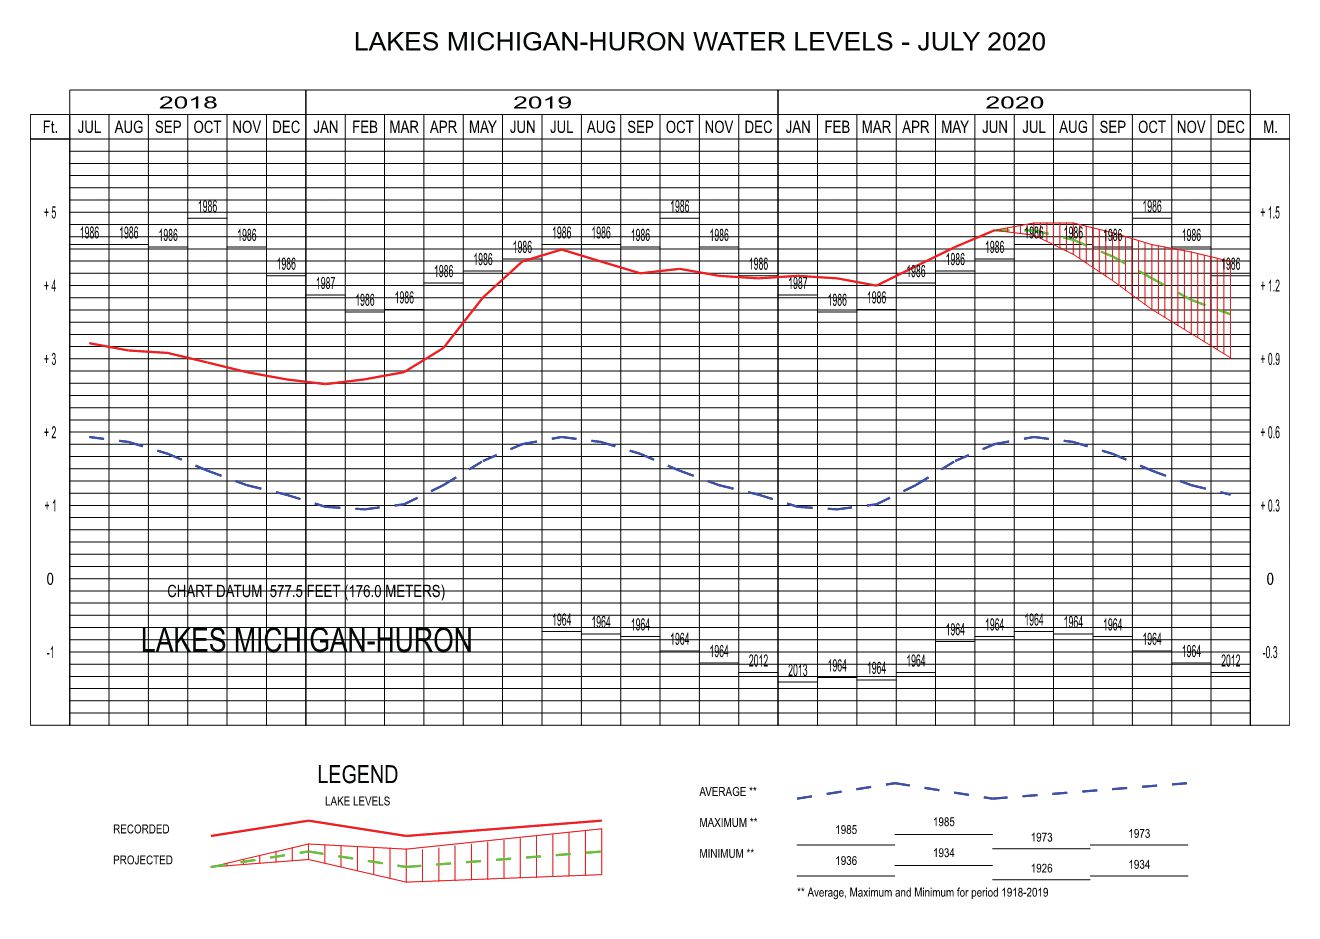
All this attention generates reams of data extending back to the early 20th century. Of particular interest are the data tracking lake levels through time. The lake levels naturally rise and fall on a seasonal basis due to precipitation over the lakes, runoff to the lakes and evaporation from the lakes. Collectively, this combined effect is referred to as Net Basin Supply (NBS), which is equal to all precipitation and runoff minus all evaporation. (A tiny fraction of water leaves the Great Lakes via outflow from the Chicago River.) The NBS determines the height of the lake levels: when inflow (precipitation and runoff) exceeds outflow (evaporation), the levels rise. When outflow exceeds inflow, the levels fall. Figure 1 compares the long-term average (1918-2019) to mean lake levels through July 2020.

Figure 1 (above) shows Great Lakes water levels from 1918-2020. Figure 2 (below)shows the more-recent water levels continuing recent trends.

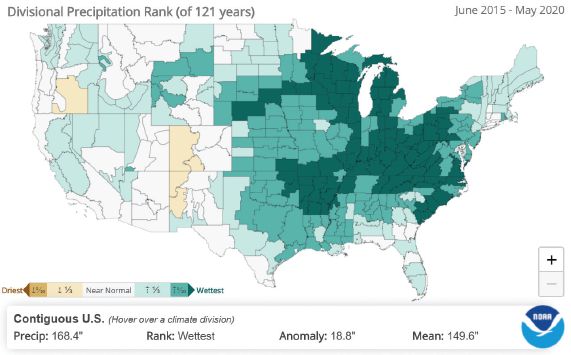
Alarmingly, the recent years from 2014 to 2020 have witnessed a steady rise in water levels across the basins, tying or breaking records set in the previous century of observation (see Figure 2). Correspondingly, as of May 2020, the wettest periods on record were recorded for the preceding 12-, 18-, 24-, 36-, 48- and 60-month periods in more than 120 years (see Figure 3). In that same time period, there have been six flooding events in the Great Lakes region that caused a billion dollars or more in damage, reaching a total of $7.1 billion.
Rise Up
Although the causes of rising water levels are complex and varied, the main contributor is excessive precipitation, often coupled with lower amounts of evaporation. This problem is exacerbated by rising atmospheric temperatures caused in part by climate change.
The 2019 report, “An Assessment of the Impacts of Climate Change on the Great Lakes,” prepared by the Midwest-based nonprofit environmental advocacy group The Environmental Law and Policy Center, notes that between 1901 and 2015, the Great Lakes region experienced a 10-percent increase in precipitation. Per data collected by the U.S. Army Corp of Engineers, the Great Lakes water levels reached record highs in 1986-1987. The levels reached another record high in 1998-99. Then, between 2000 and 2010, the levels plunged to near-record lows. Since 2014, levels have steadily risen to current record levels in 2020.
From 1985-2016, temperatures in the Great Lakes Region have increased 1.6°F, which is greater than the average contiguous national average of 1.2°F. A warmer atmosphere can hold more moisture, which can condense and turn into precipitation. A warmer atmosphere also retards evaporation, slowing the overall outflow of water from the lakes. This impacts both sides of the NBS equation, with more inflow and less outflow, resulting in rising water levels.
As water levels rise, so does the energy of waves hitting the shores. This has resulted in erosion and transport of 100,000 cubic yards of sediment toward the south end of Lake Michigan.
“We’re seeing significant waves and extreme erosion along the lakeshore,” says Keith Kompoltowicz, chief of watershed hydrology for the USACE.
Further contributing to the increased wave activity is the trend toward lower maximum ice cover on the lakes (see Figure 4). From 1973 to 2018, all the Great Lakes experienced significant negative trends in annual mean ice cover, and total ice-cover loss across the Great Lakes during the 45-winter period is 69 percent.

Forecasts and Mitigation
Due to their past and potential impacts on the region, the Great Lakes are continuously monitored by U.S. and Candian agencies in an ongoing partnership. Several agencies continuously monitor the lake levels, including NOAA’s Center for Operational Oceanographic Products and Services (CO-OPS), and the Department of Fisheries and Oceans’ Canadian Hydrographic Service. Additional research and coordination is provided by the USACE, and Environment and Climate Change Canada. Many agencies, including the GLERL, use these data to forecast lake levels. Unfortunately, experts forecast the trend in rising lake levels to continue for the next several years. To combat these negative impacts, several initiatives are underway, including the Great Lakes Restoration Initiative (GLRI).
Launched in 2010, the GLRI aims to accelerate efforts to protect and restore the Great Lakes and provide resources for critical long-term projects in the area. The GLRI creates five-year action plans developed in coordination with states, tribes, local governments, universities, business and others, and federal agencies then execute on the plan. Since 2010, local and federal governments have spent $2.5 billion, through the GLRI, on more than 4,000 projects.
The USACE is one such federal agency and operates many programs, including the Coastal Program that encompasses the entire U.S. shores of Lake Superior and Lake Huron, the shore of Lake Michigan with the exception of the Illinois shoreline, and the western portion of Lake Erie. The program undertakes research on all hydraulic, hydrologic and coastal matters pertaining to the Great Lakes.
Also operated by the USACE is the Flood Monitoring program, which monitors potential inland river flooding year round and potential flooding on the St. Marys, St. Clair and Detroit Rivers due to ice jams. The mission is to “prevent and/or minimize loss of life and property damage caused by river/connecting channel flooding.”
From May 2019 and the first week in July 2020, the USACE awarded more than $38 million in contracts greater than $250,000 (see Figure 5).

With all its complexity, predicting future water levels in the Great Lakes is a challenging undertaking. Most models look only 6 months ahead and then are rerun using newly obtained data (see Figure 6). So although no one can predict with certainty what will happen during the next decade, many see recent trends continuing for the foreseeable future. Climate change will continue to impact the region as temperature increases tip the NBS into an increasingly less-stable state. Engineers, scientists and the population in general must remain vigilant and prepared to address the challenges ahead.

Mark Scacco
Mark Scacco, P.E., is a 25-year veteran of AEC technology and design consulting. He is an AEC Industry Consultant with Scacco LLC and can be reached via email at [email protected].
Video: New Roundabout Under Construction at McIver and Old Florence Roads in Darlington County

Froedtert Hospital Expansion

June Issue 2026
.jpg?width=225)