Argonne National Laboratories Makes Climate Modeling Practical for Regional Infrastructure Asset Management
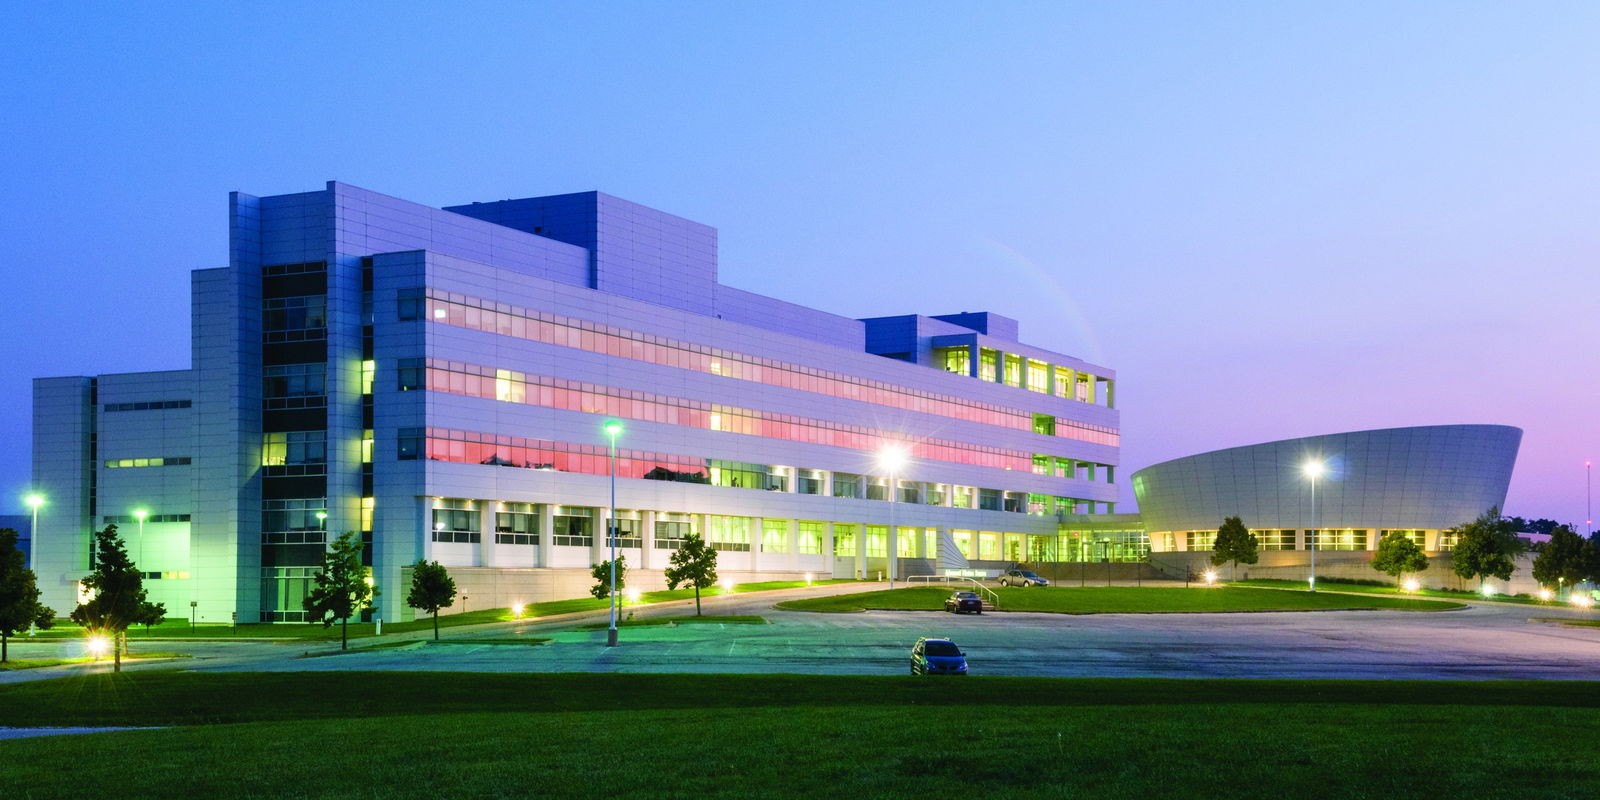
Argonne National Laboratory, located in Lemont, Ill. (just outside Chicago), has some of the trappings of an outstanding Bond villain lair, including its own 0.7-mile-circumference electron storage ring (a bit like a CERN-style particle accelerator); the Argonne Tandem Linac Accelerator System (ATLAS), which is the “first superconducting linear accelerator for heavy ions at energies in the vicinity of the Coulomb barrier”; several of the world’s largest supercomputers; and thousands of scientists and researchers beavering away at projects ranging from basic research in many fields to highly classified nuclear research. Argonne was born out of the University of Chicago’s work on the Manhattan Project in the 1940s and helped design the reactor for the world’s first nuclear-powered submarines, the USS Nautilus (which shares a name with the submarine of Captain Nemo, one of literature’s great villains).
But many more factors contradict this impression, starting with Argonne’s sylvan setting in 1,700 acres of Chicago’s Red Gate Woods (codenamed “Argonne” in the 1940s as a nod to France’s Forest of Argonne), which make the laboratory look and feel more like a nature preserve, with thick woods and extensive wetlands.
“It feels like a campus here,” says Argonne Senior Infrastructure and Preparedness Analyst Tom Wall, who has a Ph.D. in Civil Engineering. “We have all these scientists with deep expertise in mathematics, climate science, high-energy physics, you name it, all working together in the middle of a forest preserve and playing volleyball at lunch. It’s a great working environment with great facilities, and it produces great results.”
And many of those results lead to tremendous breakthroughs that make life better for all the world’s people. In 1957, for example, while designing a scanner for reactor fuel elements, Argonne physicist William Nelson Beck experimented (impulsively?) by sticking his own arm into the scanner … and made one of the first ultrasound images of the human body, paving the way for a now-ubiquitous—and lifesaving—medical technology.
Climate-Modeling Center
Currently, due to the high concentration of supercomputers and mathematical expertise at Argonne, it’s become one of the world’s leading centers for climate modeling. To date, much of this powerful modeling work has been focused on predicting global and national trends over decades. But that’s changing; by skillfully applying massive supercomputing power to existing climate models, Argonne scientists are learning how to put climate modeling to use in ways that benefit private companies attempting to make better decisions about the construction, maintenance and operation of infrastructure assets over much smaller areas (states or even smaller regions) as well as in much shorter timeframes—potentially day-to-day weather prediction.
Even a weather phenomena as famously ephemeral and hard to predict as wind can yield to the massive data gathering, research, analysis and modeling capacities of the climate scientists at Argonne National Laboratories. In 2014, Argonne scientists partnered with the U.S. Department of Energy Office of Energy Efficiency and Renewable Energy, and Vaisala, a leading environmental and industrial measurement company, to study shifting wind in 19,000 square miles surrounding Columbia River Gorge in the Pacific Northwest. For four years, Argonne scientists placed, periodically moved and monitored 200 varied sensors, including SoDAR (sonic detection and ranging), LiDAR (light detection and ranging), wind-profiling radars, radiative flux systems and microbarographs in what’s believed to be the largest-ever data-gathering project specifically on wind variance in mountainous terrain. And then, of course, they analyzed all the data to better understand and predict complex wind patterns in rough terrain.
The results were impressive and eminently practical. For wind-farm operators in the area trying to optimize their systems for daily energy production, “Even improving weather forecasts by 5 to 10 percent makes a substantial difference,” explains Rao Kotamarthi, chief scientist within Argonne’s Atmospheric Science and Climate research group, and chief researcher on this project.
Supercomputing Helps Inform Utilities and Agencies
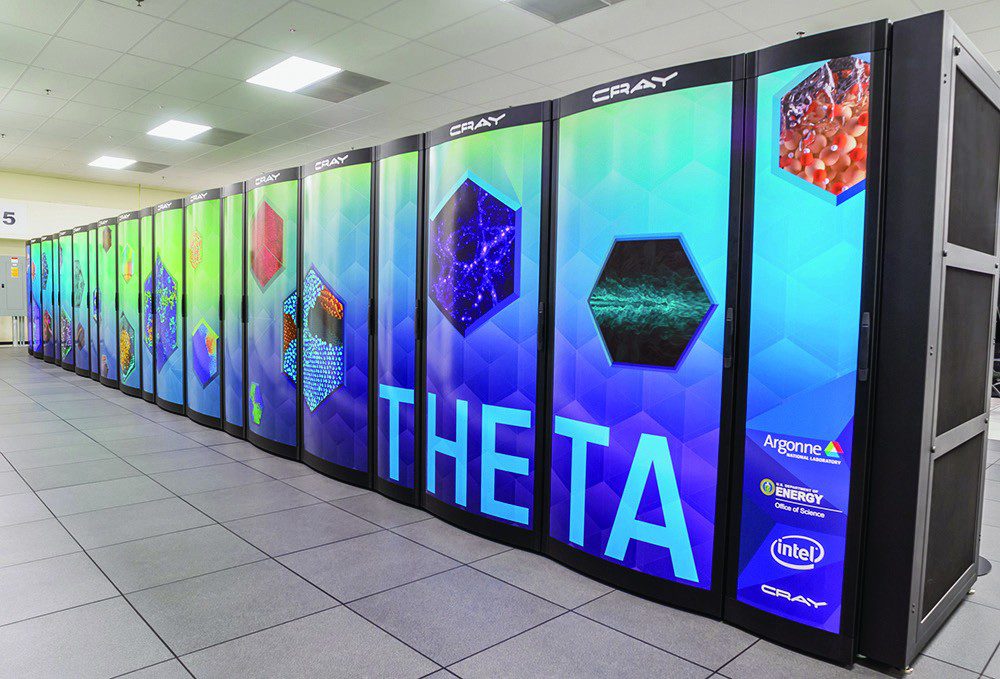
Argonne maintains substantial supercomputing power on behalf of researchers working in high-energy physics, transportation research and analysis, nanoscale materials, X-ray research, climate modeling, and other fields requiring intensive digital analysis. Two current supercomputers really stand out: Mira is a 10-petaflop IBM Blue Gene/Q system, capable of 10 quadrillion calculations per second (meaning it can do more calculations in a day than a typical personal computer can do in 20 years), and Theta, an 11.69 petaflop “massively parallel, many-core system based on Intel processors and interconnect technology, a new memory architecture, and a Lustre-based parallel file system, all integrated by Cray’s HPC software stack.”

And sometime in 2021, Argonne will deploy Aurora, which, per an article in Chicago Business, “will be the first exascale computer in the U.S., capable of 1 quintillion—or 1 billion-billion—calculations per second. It will be nearly 100 times faster than the newest supercomputer at Argonne, a machine called Theta, which debuted in 2017.”
Climate scientists at Argonne, in collaboration with other DOE laboratories, have spent many hours of supercomputing time developing excellent national and global climate models that predict trends in weather over decades. But for infrastructure designers working at regional scales to design, for example, sewer networks or telecom installations, such modeling isn’t truly useful.
“There are climate viewers and stuff like that online, but in most cases these are not truly useful for narrow audiences: engineers looking to be better informed about resiliency when considering large-scale infrastructure asset management and investment,” notes Wall. “The general trends that can tell them there will be 50 percent more stormwater in a region are not truly useful.”
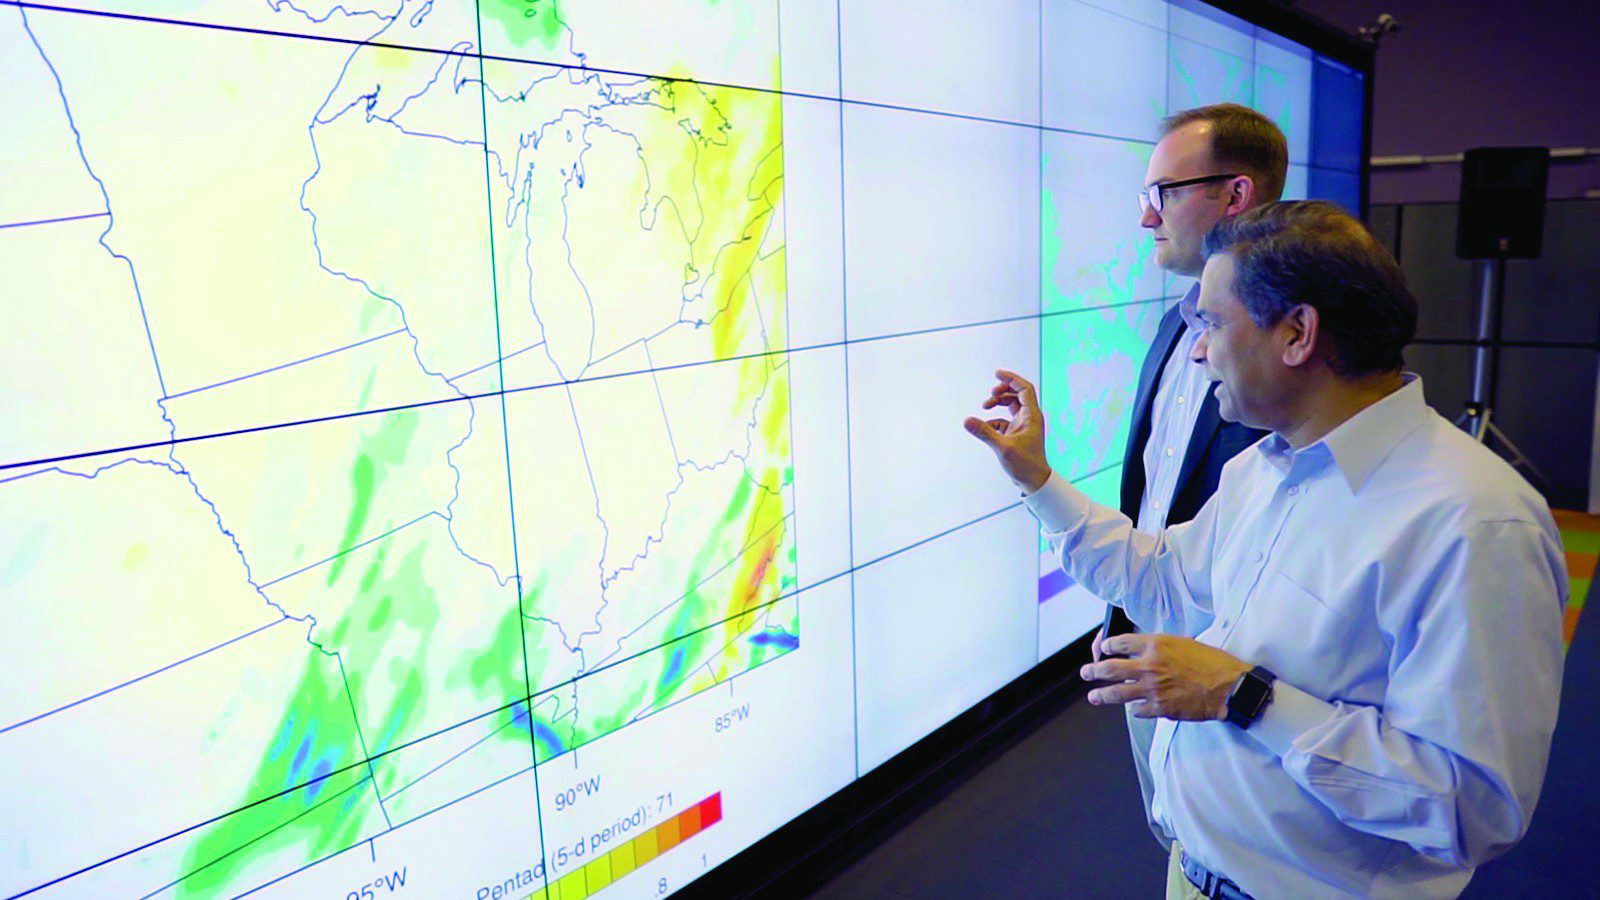
Argonne National Laboratory- Argonne’s Rao Kotamarthi (right) and Tom Wall (left; glasses) look at visualizations of climate data.
What designers really need, according to Wall, are more-accurate intensity-duration-frequency (IDF) curves and similar metrics that can tell them the intensity of, for example, 50- and 100-year storms. Such specific information absolutely leads to better and more-resilient infrastructure with real and quantifiable effects on future flood mitigation.
Such specific information is available from existing climate models, but not without taking a closer look at the myriad complexities of the models, which requires deeper analysis by climate scientists and more supercomputer time. Regarding the current “state of the art” in climate modeling, Wall says, “Our models effectively cover all of North America, and we have the ability to calculate, say, local rainfall intensities in 2050 in any part of the country. But it’s a bandwidth thing; producing higher-resolution and more-useful data requires better algorithms from climate scientists and mathematicians, and more supercomputer time, and those are still limited resources that need to be used carefully.”
AT&T and the Southeast
Such data are being generated successfully on behalf of local agencies and private utilities. A good example is a recent collaboration with AT&T, which ultimately developed the “Climate Change Analysis Tool” for a closer, more-accurate look at extreme weather events during the next 30 years in the southeastern United States.
“Global climate change does not affect all regions or communities in the same way,” says Kotamarthi. “At Argonne, we are using high-resolution models and vast statistical techniques to project climate change at regional, local and even neighborhood scales. AT&T applied this detailed information to AT&T’s infrastructure planning so it can safeguard networks and help ensure resiliency as the climate changes around it.”
Developing this genuinely useful tool was a tremendous feat of science and a good example of the expertise and computing power that Argonne scientists can bring to bear on major challenges. An Argonne technical paper describing the process, “
Argonne used three major regional-scale climate environment models to deliver on the project scope:
1. The Weather Research and Forecasting Model (WRF) was developed by the National Center for Atmospheric Research (NCAR) and used to create the foundational dataset of dynamically downscaled historic and future climate information over North America.
2. The WRF-Hydro (Version 5) Model was run at a spatial resolution of 200 meters using the output generated from the WRF downscaled climate output to simulate historic and future inland hydrology and flooding. “The 200-meter spatial resolution of the WRF-Hydro simulations was informed and enabled by a number of factors, including the types of flood risks of greatest concern to AT&T, the availability of baseline input data for the hydrological simulations, and the availability of advanced computational resources. The 200-meter spatial resolution generates sufficiently detailed outcomes to inform local decisions, while maintaining statistically robust outcomes needed for extreme value analysis,” says Koramarthi.
3. The ADvanced Hydrodynamical CIRCulation Model (ADCIRC) was used to perform coastal flooding simulations, with input from the WRF downscaled climate projections and historical data for the recent major hurricane events to drive those simulations. ADCIRC uses unstructured gridding and extremely high resolution (approximately 50 meters).
To develop its high-resolution, regional climate model projections for North America (WRF Model), Argonne dynamically downscaled existing global climate model simulations that were developed for the United Nations Intergovernmental Panel on Climate Change (IPCC) Fifth Assessment Report (AR5). This global climate dataset is known as the CMIP5 repository. The CMIP5 global climate data was regionally downscaled for a business-as-usual carbon emission scenario, known as RCP 8.5, and a second case, known as RCP 4.5, that’s closer to the Paris Agreement (2015). Under RCP 8.5, it’s expected that the total atmospheric concentration of CO2 will be more than double current concentrations by 2100.
The end result, the Climate Change Analysis Tool, is a bit like a GIS layer and is able to “visually layer AT&T’s physical asset data upon future climate impact data to help AT&T ensure safety, service, and connectivity in current and future build plans.” Specifically, it’s being used now to better predict and plan for three “priority climate impacts” listed below with excerpts from predictions made in the technical paper.
• Coastal Flooding: Two decades of water-level simulations were conducted for a historical (1995-2004) and mid-century time period (2045-2054). Overall, the results are in agreement with other studies: severe hurricanes in climate models tend to be under-predicted and occur less frequently as compared to observations.
• Inland Flooding: Extreme flood events also are projected to increase across the four priority states. For example, by mid-century, a 50-year flood event will produce floodwaters up to 10 feet deep across inland and coastal areas of southeastern Georgia.
• Hurricane and Non-Hurricane Wind Speeds: For instance, southern Florida tends to show the greatest change in maximum sustained wind conditions between past and future in both basic statistics and extreme conditions. Fifty-year-event wind speeds of 90 mph are possible for a large part of the southern Florida coastal region by mid-century.
Just Getting Started
This collaboration with AT&T is likely to be seen as groundbreaking for infrastructure resiliency design in a few years, as lessons learned already are being applied at the federal level as well as to electrical grid design in California, drought impacts in Texas, flooding and surging in New Jersey, and utility resiliency in Maine.
“At Argonne, we’re not policymakers; we just seek to make the best climate models possible and put them to use,” says Wall. “Infrastructure industry leaders like AT&T are asking us to help them with resiliency impact planning, and we’ve been able to deliver tools that do that. The word is getting out, and I think this kind of planning and use of climate models is going to be widespread.”

Angus Stocking
Angus Stocking is a former licensed land surveyor who has been writing about infrastructure since 2002 and is the producer and host of “Everything is Somewhere,” a podcast covering geospatial topics. Articles have appeared in most major industry trade journals, including CE News, The American Surveyor, Public Works, Roads & Bridges, US Water News, and several dozen more.
Video: New Roundabout Under Construction at McIver and Old Florence Roads in Darlington County
Bridge Replacement at Amsterdam Centraal Station
June Issue 2026
.jpg?width=225)