John May is accustomed to taking on challenging projects, but he soon recognized that this one would be different. Meeting the project requirements would involve multiple technologies, advanced software and a team of dedicated and—quite literally—flexible surveyors that would spend days working in a cramped underground pipe built to carry water, not humans.
The work originated from a utility owner in Northern California who needed to rehabilitate a 90-year-old buried water pipeline. Through the years, the 54-inch (137-centimeter)-diameter steel pipe had received periodic maintenance, retrofits and repairs, including a concrete lining that would introduce significant challenges as the project proceeded. The most-recent inspection, however, revealed the need for more extensive work. Because the pipeline lies close to major traffic arteries and a water-treatment plant, excavation to repair or replace it would be prohibitively expensive and disruptive.
The client’s engineers decided to use a process called “slip lining” to install a new pipe inside the existing water main. The approach would eliminate the need for extensive excavation and greatly reduce the time and cost of upgrading the old infrastructure. In order to design the slip lining and installation process, the engineers needed precise information on the existing pipeline.
The work fell to May, a project manager at California-based Towill Inc. He and his colleagues were called on to survey the interior of roughly 1,800 feet (550 meters) of the active, pressurized waterline.
In addition to determining the horizontal and vertical alignment of the pipe, they needed to provide data on the pipe’s ovality (deformation from its original circular shape) caused by external loading at the surface. May explained that the waterline had been installed as two semicircular sections welded together using lock-bar joints to form a continuous pipe. Through time, the top of the pipe had deflected downward in some areas, limiting the space available for the new slip lining. The engineers also asked for information on bends and vertical deflections in the alignment, the ends of visible lock bars, and the locations where transmission and distribution lines connected to the main.
The Towill team knew that the only way to gather such dense, detailed data was from inside the pipe. It would not be a fun place to work.
Barriers to Entry
“It was difficult going from the very beginning,” says JR Gregory, a geospatial specialist at Towill who led the pipe survey as well as data processing. Because the pipe served as an active water main, the client was determined to minimize the time it could be shut down and drained for the survey.
“Our original plan called for 10 days of work inside the pipe,” recalls Gregory. “But that was shortened to eight.” In addition to the unforgiving schedule, the survey data needed to be accurate and complete. There would be no possibility to return to the site to collect any missing or questionable data.
May explained that in the “old days” the interior of the pipe would be measured using a wooden cross frame that could adjust to find the size of the pipe. The process is very slow, labor intensive and prone to inaccurate or incomplete data. It can’t accurately locate bends and other aspects that are important in making the slip line fit.
3D scanning was proposed, but it also came with some concerns. “We often use a blend of systems to maximize the value and efficiency of our services, but this project really put us to the test,” adds May. “There was a suggestion to use a remotely operated transporter called a ‘pig’ to move through the pipe carrying a lidar scanner. But we determined that approach couldn’t produce the needed accuracy.”
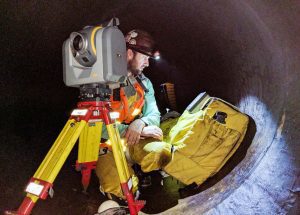
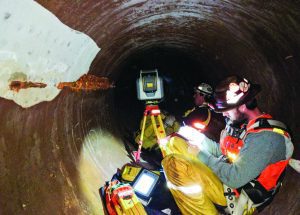
Drawing on their broad experience in laser scanning, the Towill team decided to use both a 3D scanner and total station. They selected a Trimble S7 total station and a Trimble SX10 scanning total station, both controlled using Trimble Access software running on a Trimble Tablet. Towill also owned a Faro Focus X330, which could handle the short-range measurements needed for the work. In places, concrete lining reduced the interior diameter to as little as 48 inches (1.2 meters), and the scanning setups were as little as 24 inches (60 centimeters) from the pipe walls.
Prior to the field work, the team tested its methods and targets in a corridor at their office. The poor lighting inside the pipe raised concerns. “We were aware that in this environment some of the intensity values might bleed out on the checkerboard targets,” notes Gregory. “To guard against that, we used a mixed approach of spheres and checkerboard targets.”
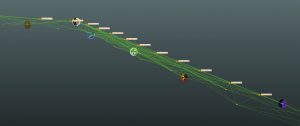
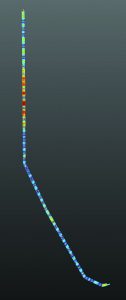
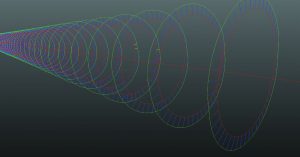
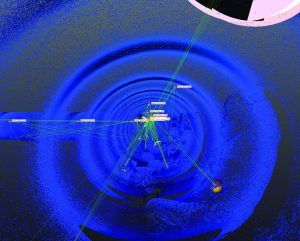
Images show part of the network of targets, traverse stations and scanner locations produced using the S7 and SX10 (Top) as well as a plan view of part of the point cloud showing scanning setups (below). Colors indicate variations in scan intensities.
The team initially planned to use magnetic mounts to attach the spherical and checkerboard targets to the pipe interior. But the concrete lining was several inches thick in places, and the magnets couldn’t hold tightly. They ended up using epoxy to attach many of the targets to the lining. In other locations, targets were mounted on tripods.
Because the surveying needed to relate only to the pipe itself, the Towill team could reduce costs for their client by using a simple coordinate system. They developed a plan to establish local coordinates for the scanning targets in the pipeline. They used the Trimble S7 to conduct an open traverse through the pipe, measuring multiple angle sets at each setup. This was followed by the SX10, which provided an independent check on the traverse and also produced scanning data on every sphere. Both instruments performed well in the dank, low-light conditions.
“Our concerns regarding the target bleed-out came true,” adds Gregory. “A large number were not visible in the scanner’s point cloud. However, the SX10 saved the day by providing control values on every sphere without having to revisit them. Because we had problems with the targets staying fixed to the walls, we wanted to stay clear of them and avoid any activities that could affect the accuracy
of our data.”
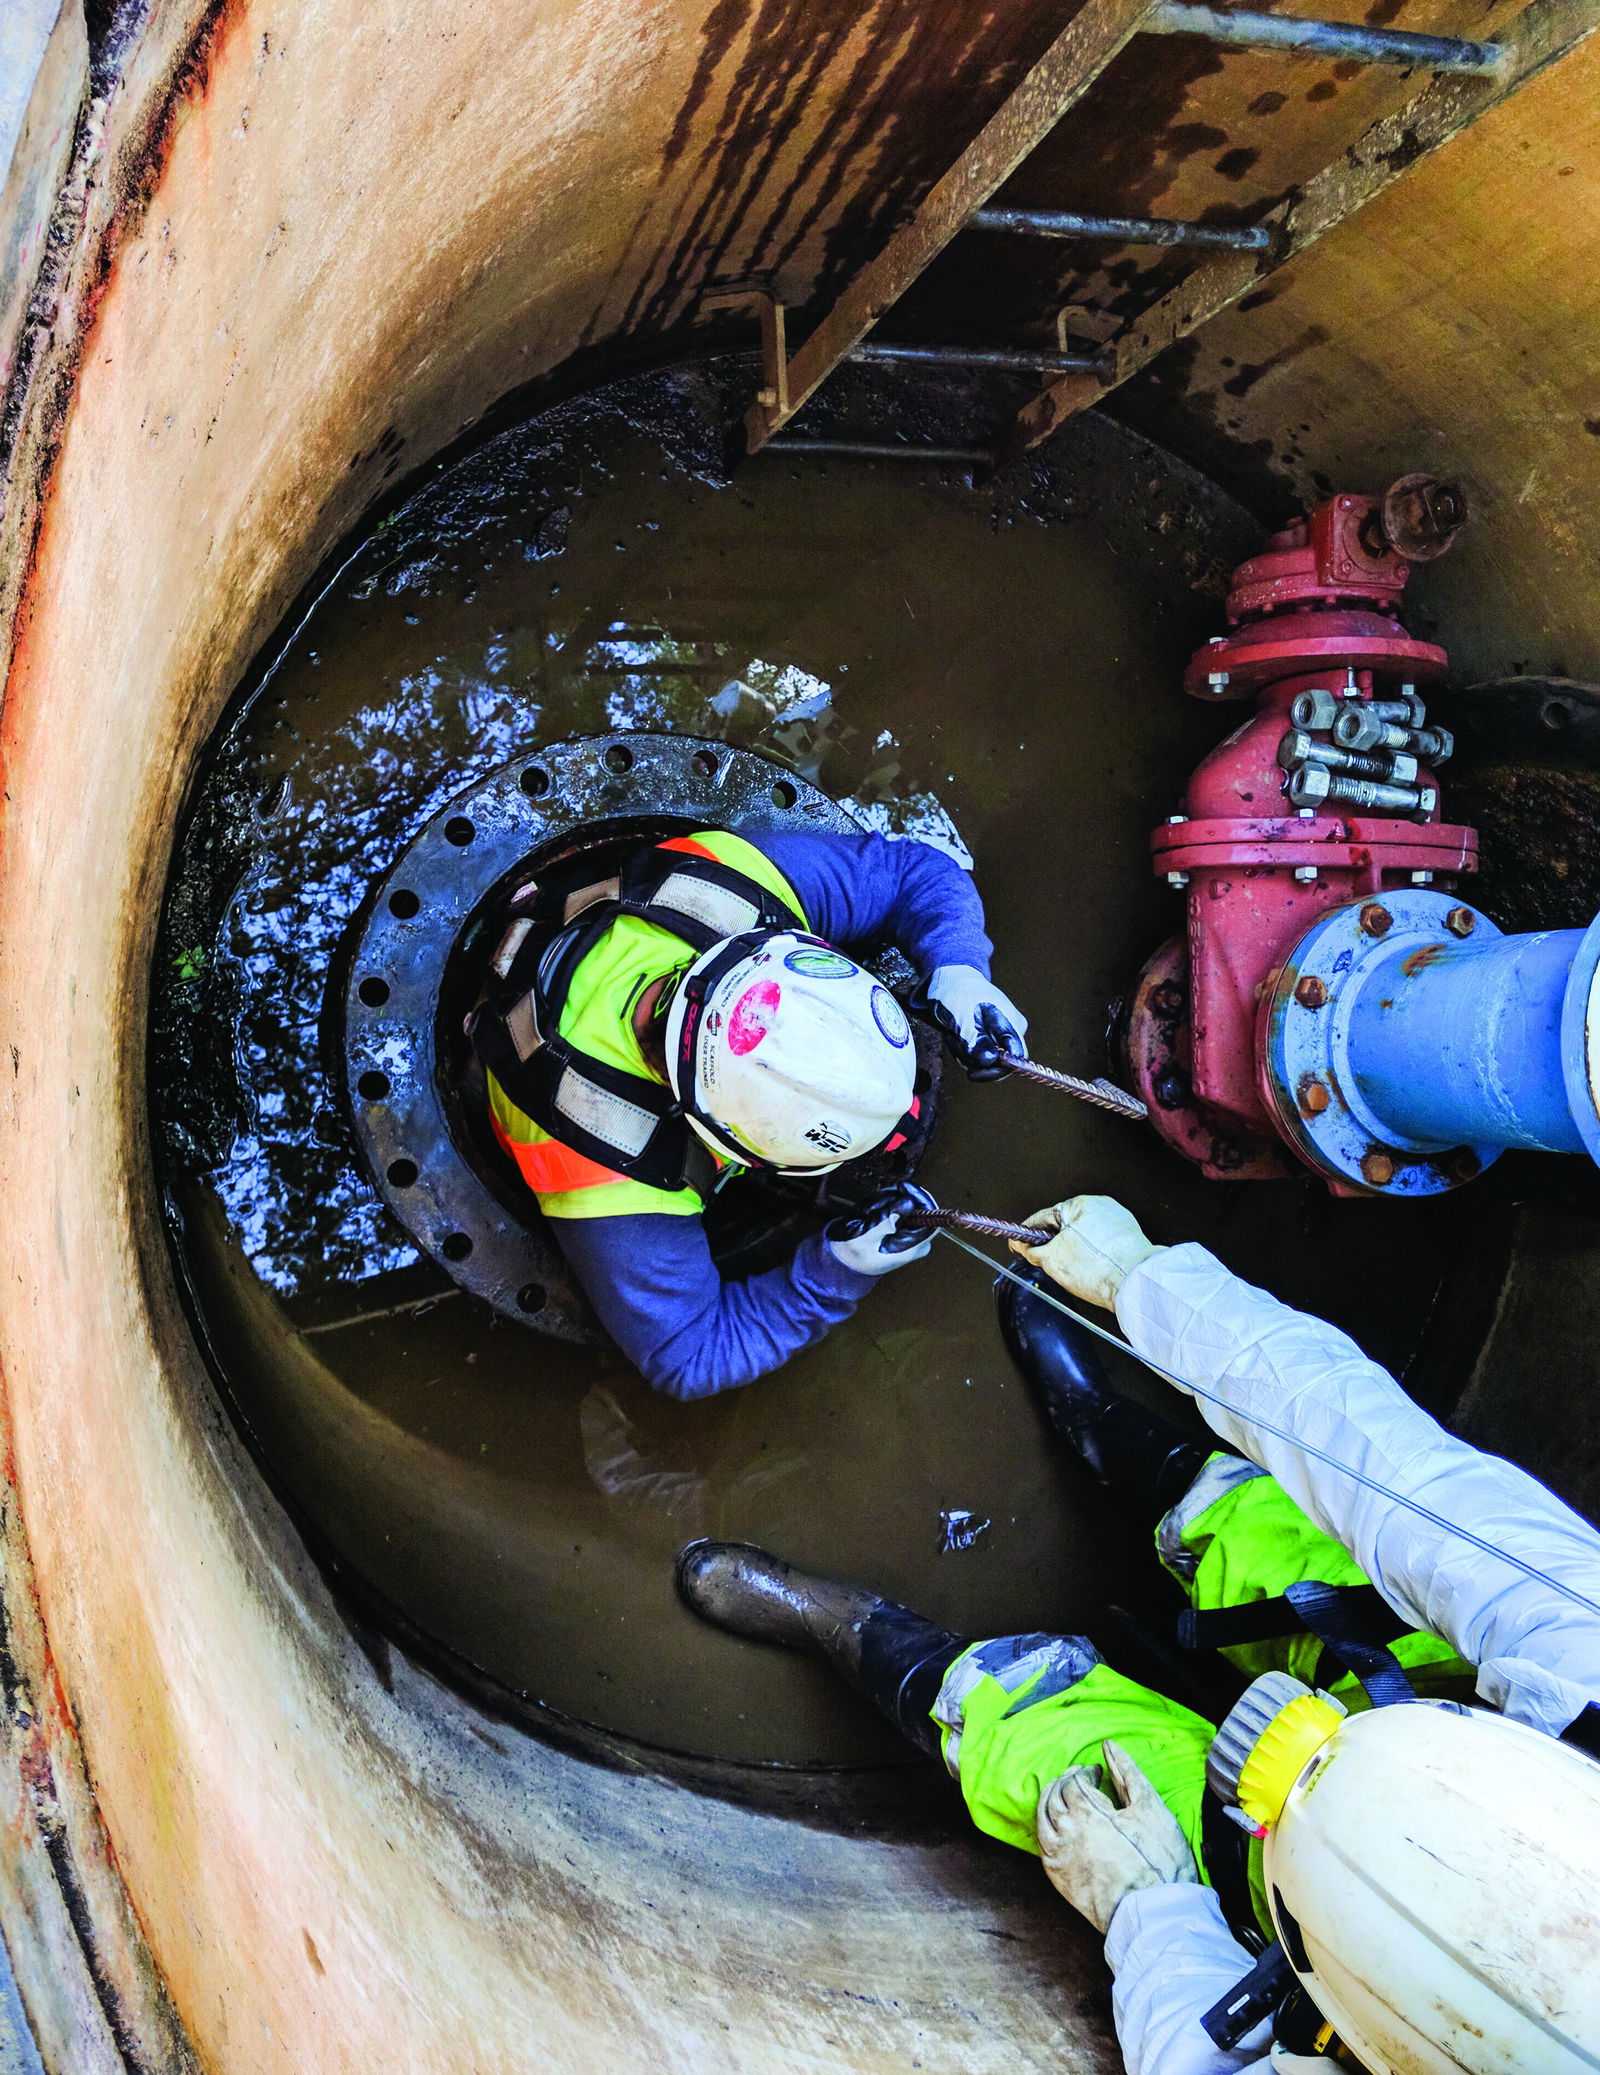
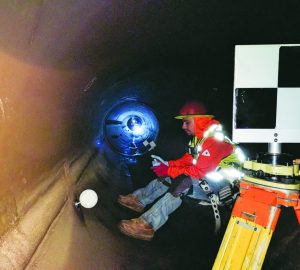
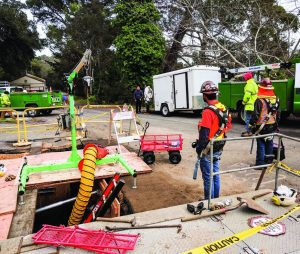
Towill selected a four-person survey team for the field work. The surveyors were put through extensive safety training to qualify for access to the confined spaces. Just getting into the pipe required special harnesses and climbing through access portals as small as 18 inches (45 centimeters) in diameter. The client provided additional staffing for safety and aboveground support.
“It was not a pleasant environment,” notes Gregory. “The access ports got smaller as the work progressed, and the instrument cases wouldn’t fit through the manholes. We put the instruments into old GPS backpacks to carry and protect them. The pipe was shut down, but water remained in many places.”
Accessing the pipe from three different locations, the teams completed the traverse and scanning in eight days. The traverse stations were roughly 150 to 200 feet (45 to 60 meters) apart. The team completed a total of 130 scanning setups at intervals of 15 feet (5 meters). When the surveyors were done, the pipe was sealed and water flow resumed. There would be no going back.
Tight Spaces and Tight Specs
Gregory processed the data from the S7 and SX10 using Trimble Business Center software (TBC). After final control values were determined, he processed the SX10 scans and converted them into a project in Trimble RealWorks software (TRW). To provide additional quality analysis, he compared the checkerboard target locations to values obtained from the S7 data.
“The results were well within our project tolerances except where a target was accidentally bumped,” says Gregory. “This redundant parallel traverse provided an additional QA/QC benefit of the work. It saved time, as we had unknowingly bumped several targets during work in the restrictive environment.”
He used a semi-automatic process in TRW to extract coordinates and elevations for the spheres. In many places, those values would be used to compute the location of the scanner.
With the control established, Gregory next imported the scanner data into TRW and registered the scans into a single point cloud. He made additional quality checks and confirmed the maximum residual for all scanner locations was 0.03 feet (9 millimeters).
The point cloud then was cleaned to remove noise and unwanted objects captured in the scans. Due to the confined space, the surveyors and their equipment often were captured in the raw data and needed to be removed from the point cloud. From the clean, fully registered point cloud, Gregory created a best-fit horizontal and vertical alignment along the center of the pipe. When the team analyzed the alignment, they found multiple horizontal and vertical angle points that were not shown on any earlier plans or as-built drawings.
To model the proposed slip line, Towill technicians used TRW to create a design cylinder inside the point cloud. The cylinder was extruded along the best-fit alignment, and the software automatically compared the cylinder to the point cloud at 0.25-foot (8-centimeter) intervals. This clash-detection analysis enabled Towill to recommend the optimal size for the slip line as well as identify areas of potential problems. For example, bends or constrictions in the existing pipe could cause binding during installation of the new lining. To avoid this, Towill recommended shorter segments of lining be used in certain areas.
In addition to technical reports, Towill exported the results in AutoCAD Civil3D and LAS formats. The combination of TBC, TRW and Civil3D enabled the team to visualize and analyze the data for sharing with the client’s engineers.
The Value of a Well-Planned Survey
May and Gregory emphasized that the success of the project was a result of planning and collaboration. They took the time to understand what was needed as well as develop workflows to suit the environment and project. Old tripods were cut down to fit in the space, and Gregory joked about “picking short guys” to perform the field work.
The survey has more than paid for itself. Using the Towill data, the client could install the largest possible liner to maximize the pipe capacity and do it without major excavation in two major roads and industrial zones. They avoided millions of dollars of costs for excavation, traffic delays and economic distress to local businesses.
“Things are on track with their construction schedule,” adds May. The survey and analysis exposed areas of conflict and enabled engineers to adjust for problems before they occurred. “Our work will greatly reduce changes in the field that the client might have encountered if forced to use less accurate and comprehensive data.”

John Stenmark
John Stenmark is a writer and consultant working in the geospatial, AEC and associated industries; email: [email protected].
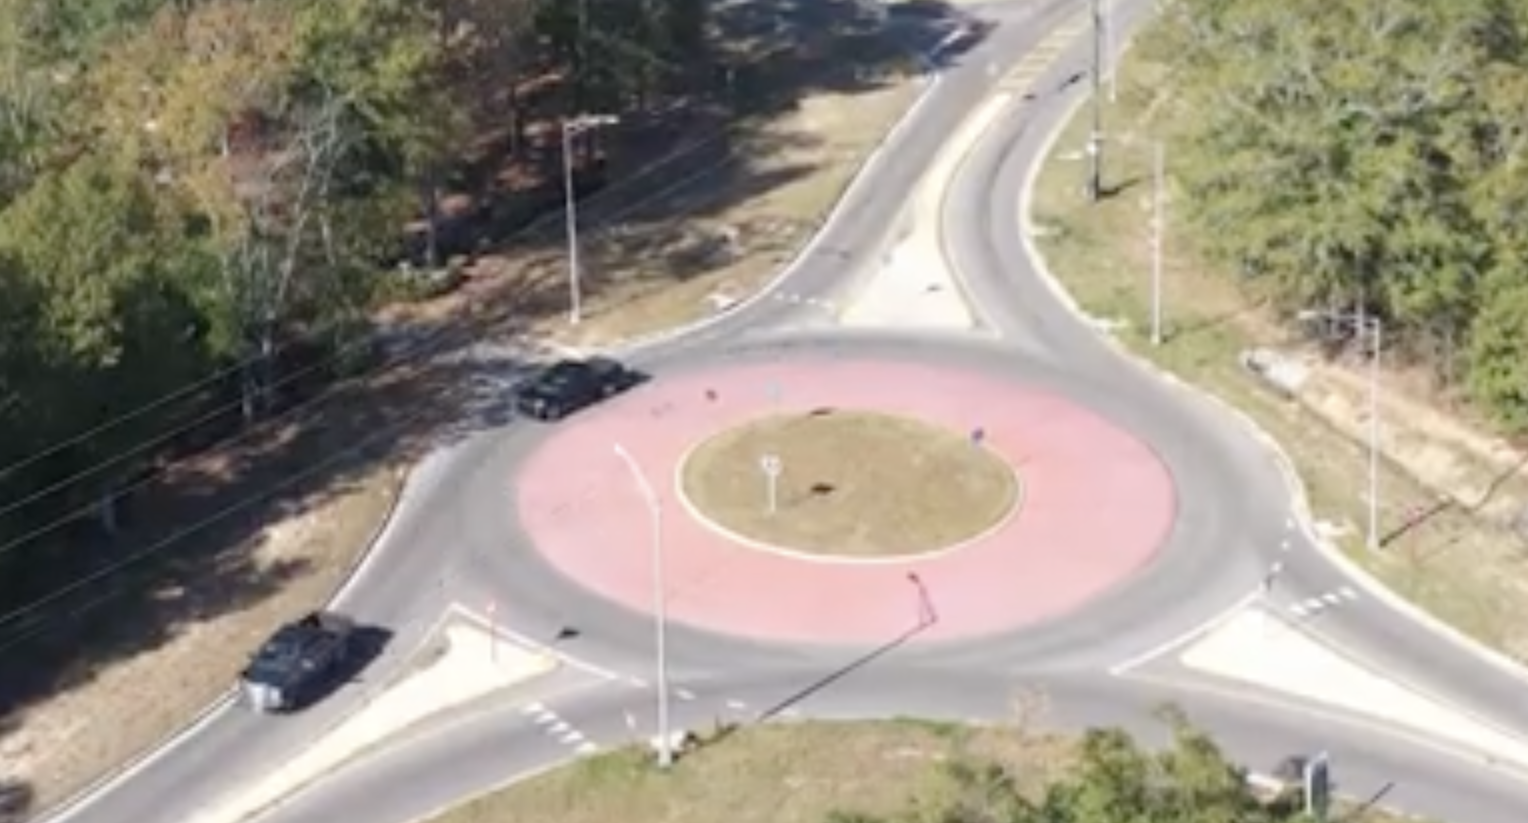
Video: New Roundabout Under Construction at McIver and Old Florence Roads in Darlington County
Bridge Replacement at Amsterdam Centraal Station

June Issue 2026
.jpg?width=225)