Construction Costs for Most Power Plant Types Have Fallen in Recent Years
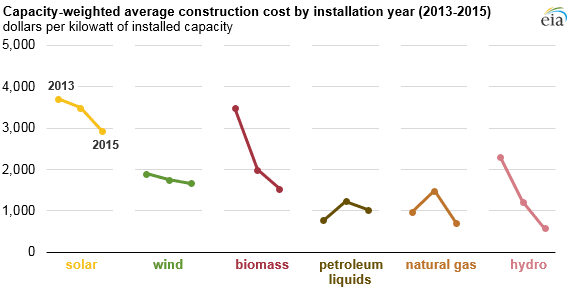
Based on EIA survey data for new, utility-scale electric generators (those with a capacity greater than one megawatt), capacity-weighted average construction costs for many generator types have fallen in recent years. Annual changes in construction costs include the effects of differences in the geographic distribution of installed capacity between years, differences in technology types, and other changes in capital and financing costs.
EIA began collecting data on construction costs for new utility-scale generators installed in 2013. The data for each year reflect projects completed in that year. Because power plants are often constructed over several years, reported costs are not necessarily indicative of the cost of a project initiated in that year. Government grants, tax benefits, and other incentives are excluded from these costs.
Construction costs alone do not determine the economic attractiveness of a generation technology. Other factors such as fuel costs (for generators that consume fuel), utilization rates, financial incentives, and state policies also affect project economics and, in turn, the kinds of power plants that are built.
In 2015, wind, natural gas, and solar were the most commonly added capacity types, adding 8.1 gigawatts (GW), 6.5 GW, and 3.2 GW, respectively. In the case of wind and solar, almost all of these additions (98% and 91%, respectively) were at new plants, as opposed to new generators at existing plants.
For natural gas, about 60% of the capacity added in 2015 was new generators at new plants, and the remaining 40% were new generators at existing plants. For other fuels such as hydro and petroleum liquids, which had relatively little capacity added in 2015, almost all of those additions were located at existing plants. Construction costs for battery storage units are available for the first time in 2015.
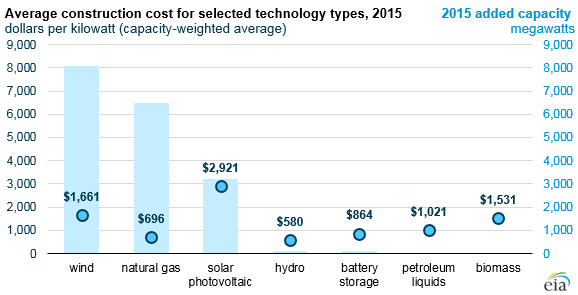
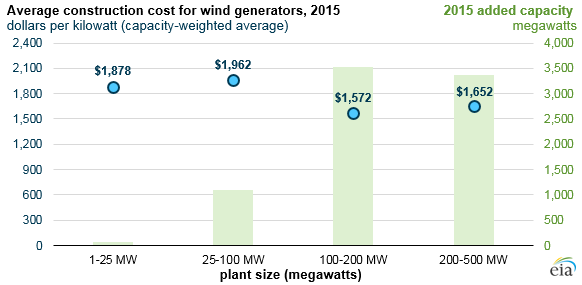
The capacity-weighted cost of installing wind turbines was $1,661 per kilowatt (kW) in 2015, a 12% decrease from 2013. Costs tend to be lower for larger wind plants, as plants above 100 megawatts (MW) averaged lower costs than those below 100 MW, likely reflecting economies of scale.
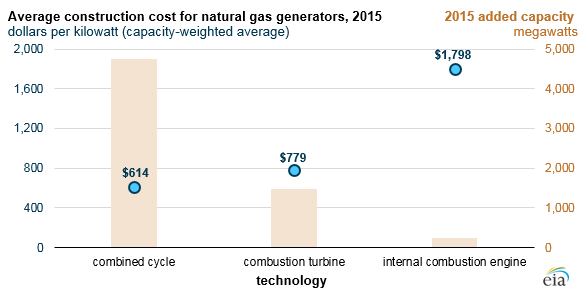
The average cost of natural gas generators installed in 2015 was $696/kW, a 28% decline from 2013. Nearly 75% of the natural gas capacity installed in 2015 were combined-cycle units, which had an average installed cost of $614/kW. Combined-cycle natural gas plants include at least one combustion turbine and one steam turbine and are generally more efficient than plants with combustion turbines alone. About 1.5 GW of natural gas plants with only combustion turbines were installed in 2015, at an average cost of $779/kW. Natural gas plants with internal combustion engines were more expensive, averaging $1,798/kW for the 0.2 GW installed in 2015.
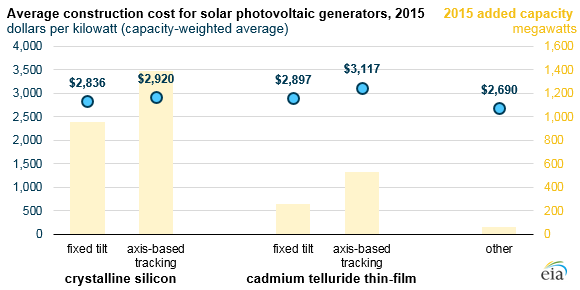
The cost of utility-scale solar photovoltaic generators declined 21% between 2013 and 2015, from $3,705/kW to $2,921/kW. More than half of the utility-scale solar photovoltaic systems installed in the United States track the sun through the day, and in general, those systems cost slightly more than those installed at fixed angles. Construction costs differed slightly by technology type, with crystalline silicon systems (73% of the 2015 installed solar photovoltaic capacity) costing slightly less than systems with thin-film panels made using cadmium telluride.
More information is available in EIA’s construction costs data, which is based on data collected through EIA’s Annual Electric Generator Report (EIA-860). Construction costs for generators installed in 2016 are expected to be available in January 2018.
Principal contributor: Owen Comstock