Transportation Engineers Make More Informed Decisions by Visualizing Multiple Years in a Single View with Fugro iVision 4.5
Many asset managers face the daunting challenge of making appropriate maintenance decisions at the right time especially when sites are miles away from them. With time-saving advancements in computer technology, asset managers can now readily analyze road conditions to determine if they have been maintained properly or are in need of maintenance. They can quickly review the road conditions to determine if additional site characterization surveys are required. The data collected from the survey can immediately be distributed to all the specialists looking for any changes in the asset condition or performance. This means less time reviewing data and more time identifying trends. Transportation agencies can easily recognize which roads are prematurely deteriorating or performing longer than anticipated. iVision 4.5 provides confidence that the data is consistent with historic trends and helps to validate the most efficient maintenance strategy.
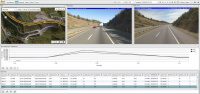
The improved user interface of iVision 4.5 as well as the addition of more powerful features gives transportation agencies a better comparison of year-over-year results. Opening multiple, synchronized iVision windows displaying several years of Right-of-Way (ROW) images simultaneously gives decision makers a clear view of the asset trends. An enriched user experience is possible through faster online remote access to asset management data and images. Being able to view images on a larger scale using multiple monitors provides a quick glimpse at the trends displayed via tables, charts, and thematic maps.
The latest iVision release by Fugro Roadware is an enhancement to the existing platform. Developed to be more intuitive to users, iVision 4.5 web-based application has the tools needed to view asset data year-over-year and to make comparisons to an agencies’ performance measurement model. iVision also generates documented and timestamped proof of the changes in conditions and is quick to identify with changes isolated between years. By taking full advantage of the high resolution images that are collected, decision making is supported by providing a relationship that is at a granular level for distress and visual condition of the segment. The ability to view multiple years of data simultaneously makes areas of change to the pavement surface and surrounding areas readily visible and easy to understand; and taking a closer look on the screen is simple.