Achieving Model-Based Design for the Smart Grid
Smart Meters and SCADA Contribute a Big Data Perspective
Smart meters and intelligent electronic devices provide granular data about the state of the utility network in near real-time. The availability of such data is in no small part what is making the smart grid, well, smart. Now, this data is being harnessed by utilities for greater customer insight and designs that are informed by performance.
In one sense, the smart-grid is a dynamic real-time system that adapts and heals as conditions on the network change. But in another, very real sense, the smart grid is designed from the bottom up to be flexible and adaptable, and model-based design allows for the simulation and analysis that facilitate that adaptability under a variety of conditions.
Big Data Opportunities
Much has been written about the large quantities of data now available for analytics. So much data is available that it has been termed a “Big Data” problem. Big Data is a name used with more or less rigor by those with varying interests in the management of the problem, or simply the application of the opportunity. In the information management space, Big Data has a specific meaning that is characterized by three V’s: volume, variety, and velocity (a framework proposed by Gartner in the late 1990’s). This framework has been widely adopted, and in many cases extended with additional V’s or other characteristics. To those more interested in applications, the Big Data label is applied more casually to large datasets that provide detail that varies over time, with fine granularity.

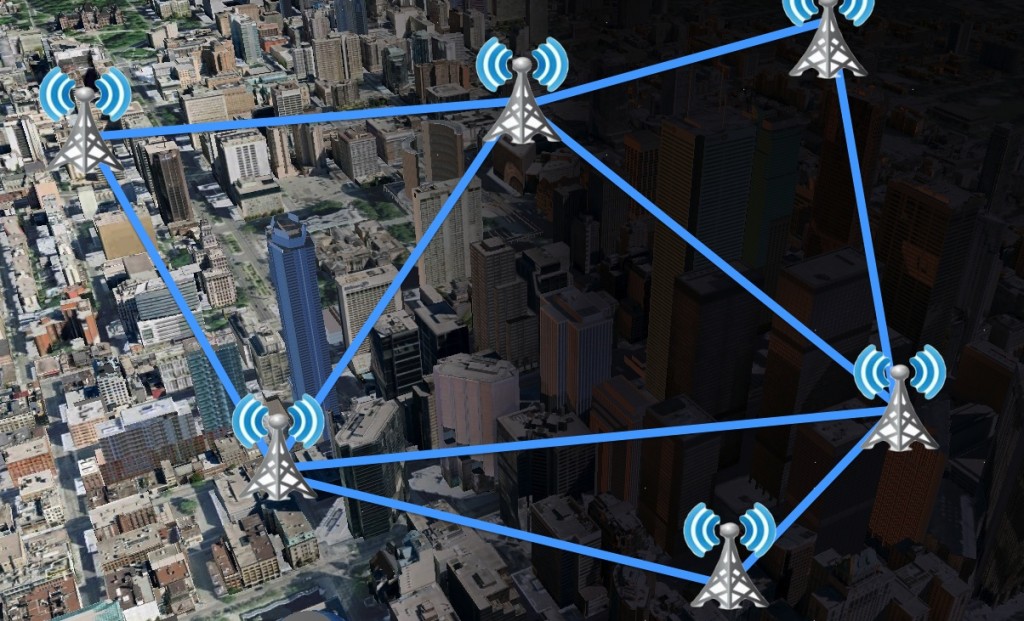
Sensor networks collect data that provide a window into conditions changing in both time and space, enabling discovery of dimensionally emerging patterns.
Whether one agrees with the formal definitions or identifies with the opportunities inherent in large datasets, one thing is clear, the use of greatly enhanced volumes of data provides unprecedented opportunities for analytics. In domains ranging from utilities to transportation, from location-based services to government, analysis has taken a forefront. Business analytics is one of the most rapidly growing segments among knowledge workers today. Gartner estimates business analytics as a 12 billion dollar industry, driving growth opportunities even in mature sectors. Location-based services in particular has seized on the notion of business analytics, of analyzing customer purchasing patterns in time and space, and making recommendations that capture the attention of customers at the point of purchase.
Data and Models
One factor driving the growth of Big Data, whether the term is used casually or academically, is the availability of real-time data. Sensor networks have been widely deployed in the environment, capturing data and reporting back continuously or nearly continuously in five-minute or 15-minute intervals. Data collected from the environment provides a window into conditions that change in both time and space.
Patterns emerge dimensionally, and the availability of data on these dimensions provides rich opportunity for analytics. Much more so than with batch data that is purchased from sources on a monthly or quarterly basis, or that is field collected on a quarterly or yearly basis. Again, consider location-based services, an industry that is driven by the availability of data that is fresh, because consumers are fickle and that “got to have” item of today is often left on a shelf tomorrow.

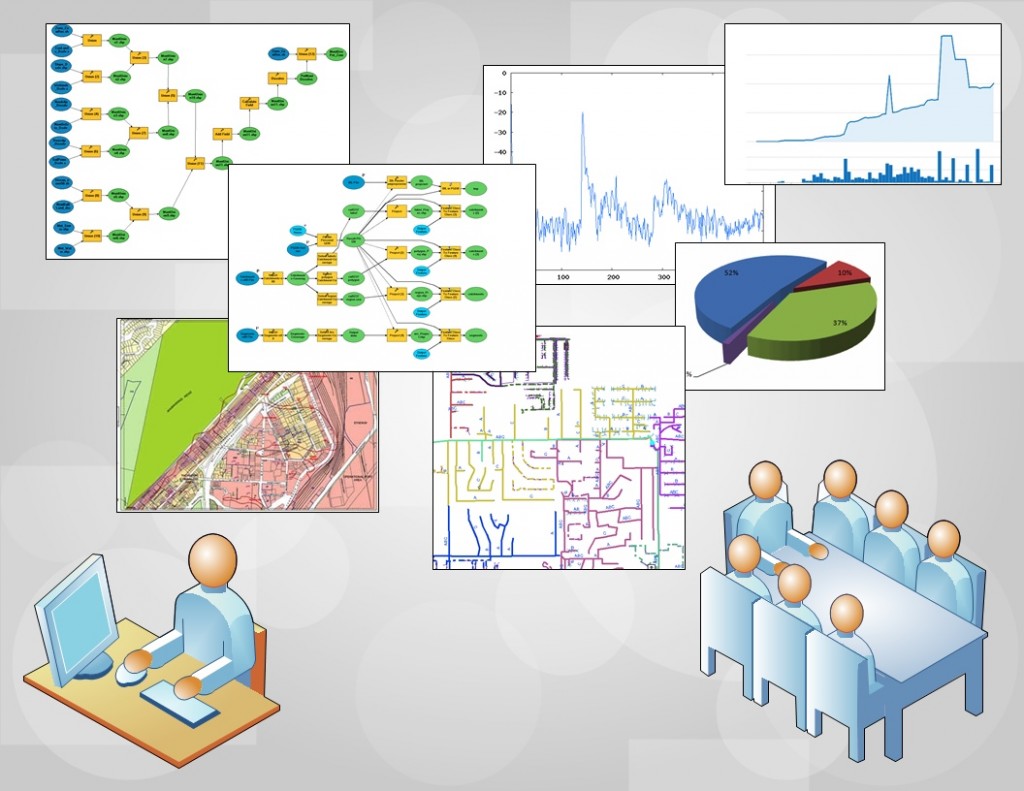
Model-based design marries the tools of science and statistics with human creativity, allowing elaboration of multiple scenarios each with opportunities and consequences.
Analytics tools look for patterns in what has happened in order to predict what will happen or in many cases what could be made to happen. Model-based design has much in common with analytics, but also has many significant differences. Both disciplines, of course, share the view that understanding what has happened is key to creating a desirable future.
In model-based design, data about past performance of similar designs is applied to the design in order to show how the design will perform under various parameters. The availability of good data is key, with the old adage of “garbage in, garbage out” as true here as anywhere. But model-based design differs from traditional analytics in the sense that analytics is focused on description of the past to unlock what is probable, while model-based design is interested not only what is probable, but what is possible.
Analytics is a rigorous, science and statistics-based approach. Model-based design brings the tools of science and statistics to bear, but also relies on human creativity and the elaboration of many potential scenarios that all have opportunities and consequences along with design tradeoffs. Model-based design goes beyond traditional design in the sense that traditional design relied purely on the expertise of the designer, along with the gut feel of what was right, while model-based design substantiates that instinct with supporting data.
Meter Benefits
Nowhere is the availability of large amounts of near real-time data more evident than in the utility industry. Smart meter deployments in the past decade have escalated according to the Institute for Electric Efficiency (IEE), with more than 65 million meters to be deployed by 2015. These meters collect data about consumption in increments of 15 minutes to an hour, across the entire service territory.

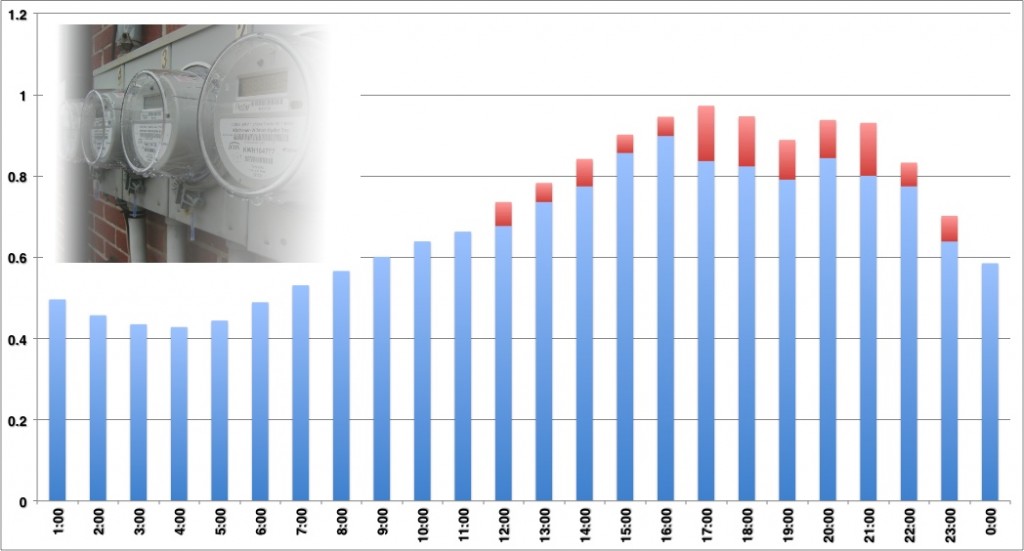
Smart meters allow the definition of granular customer load profiles that influence capital planning and design.
In the past few years, smart meters have been consolidated into a smart grid strategy, which includes not only smart meters but also intelligent electronic devices that provide automation for protection and controls, SCADA (supervisory control and data acquisition), distributed generation, distributed energy storage and other technologies. Through SCADA, data is obtained for not only the consumer (the point of consumption at the meter) but also along the feeder, measuring power quality or voltage levels along the distribution network. Smart meters and SCADA provide granular data about the state of the network, in near real-time.
Smart meter business cases have generally demonstrated benefits in three categories, according to a study of more than 30 business cases done by eMeter.
- The reduction in utility customer service costs is gained simply by reducing the number of activities for which field crews have to to be dispatched: reduction or elimination of meter reading, remote connect and disconnect. Customer service costs are also reduced by optimizing call taking, and reducing the number of actual calls for estimated bills.
- Additional utility efficiencies are gained by improving the ability of outage management to correctly predict the faulting devices, by reducing system losses and energy theft through more granular monitoring, and through better planning (targeted asset investment planning and right-sizing equipment to avoid overloads or underutilization).
- Customer benefits are achieved by improving energy efficiency, managing peak demand, and improving customer satisfaction.
Smart meters also provide environmental benefits, principally around reduced emissions from reduced fleet miles and reduced power generation. Other smart grid technologies such as intelligent electronic devices and SCADA are key to many additional benefits, including support for monitoring for power reliability and quality, efficiency through voltage optimization, remote command and control, improved safety and security by sampling energy usage at points along the network. These technologies also support the ability of the utility to connect distributed and renewable generation, to define and manage micro-grids for localization that improves reliability and efficiency locally, and to connect new technologies for energy storage into the network. With these classes of benefits in mind, the potential for model-based design becomes clear.
Customer Insight
One of the immediate opportunities that smart meters provides is the ability to capture granular consumption information in regular increments. Not so long ago, utilities read the meter once a month or less, resulting in estimated reads that often resulted in frustrated customers with complaints about bills. With one read a month, the utility had twelve readings per year about customer usage that made it hard to draw any sort of trend.
With meter reads as frequent as every fifteen minutes, the utility now has more than ten thousand readings per month and more than one hundred thousand readings per year per customer. This granularity provides an important opportunity for profiling customer loads. Historically, utilities would generate load profiles for two or perhaps four seasons per year, generalized across all customers in the class. With smart meters, it is possible to have a unique customer load profile for each customer, to have load profiles not just for seasons of the year, but even for times of day.
Having these options means that utilities can perform targeted asset investment planning not for just ten generic customer profiles, but literally for each customer. While it’s likely that such an opportunity would be overwhelming for the utility, it is also possible to strike a balance with a more granular set of customer profiles – say, a hundred or more distinct load profiles for customer types, times of day, days of the week, and more.

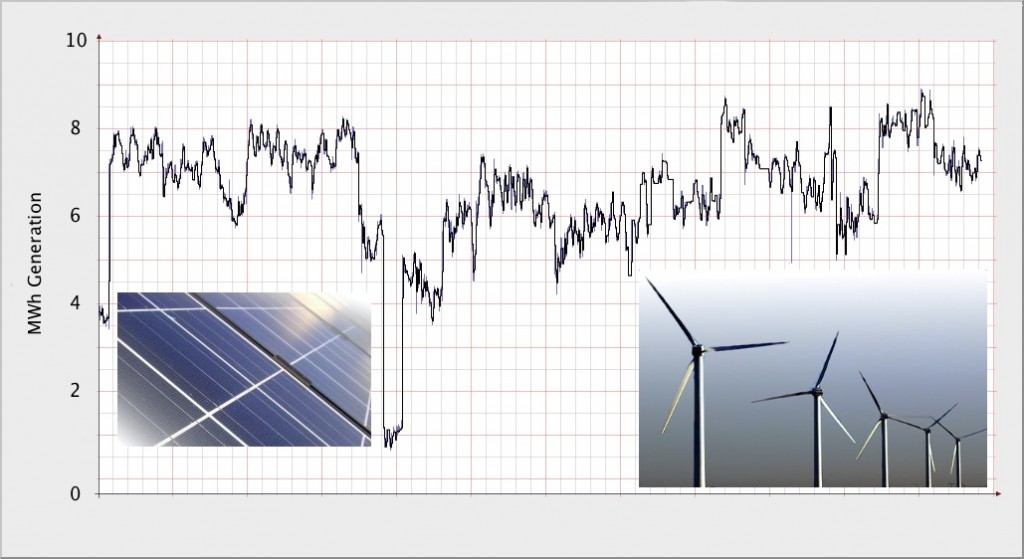
Historical information from SCADA on energy generated generated from distributed and renewable resources informs asset investment planning to optimize feeder configuration and equipment.
Layering in geospatial data such as demographics or socioeconomics allows further refinement of those customer profiles. Layering in distinct customer load profiles allows the utility to target asset investments to right-size, procuring equipment that is not insufficient (affecting reliability) but also is not underutilized (impacting the bottom line).
Distributed Generation
Power flow traditionally has been one-way, from the source to the sink, but distributed generation is standing this concept on its head. Traditionally, power generation is the source and energy flows out through transmission systems that is stepped down to a lower voltage to flow out through distribution systems, stepped down again at transformers, and finally delivered to the customer that serves as the sink. With distributed generation, instead of serving as the sink the customer is now generating power and putting it back onto the network, serving as a source.
Conventional electric equipment is not designed to handle this opportunity for backfeed, where power is going “the wrong way”. For example, a transformer steps power down to deliver to the customer, it doesn’t step power back up to put it onto the grid. It also creates safety implications where crews may disconnect the upstream feed, but power may still be coming from downstream. SCADA provides the opportunity to monitor the network at the point of connection where the distributed generator is connected back in so that a construction design alerts the crews that disconnection is required both downstream and upstream.
Historical information on actual energy generated in the intermittent case of renewable energy, where generation may vary over times of day or seasons of the year, can also inform asset investment planning so that feeder configuration and equipment is optimized for the various sources now available.
Aside from practically being a requirement for distributed generation, SCADA also provides a host of other benefits. SCADA provides power quality information, measured at various points along the network. Based on power quality data, the utility can utilize a distribution management system (DMS) to perform volt-VAR optimization (VVO) in real-time. Power is typically delivered at 120 volts, but the customer may be able to suffice with a lower voltage level without impacting power quality, such as a 10% reduction to 108 volts, resulting in a gain in efficiency. Volt-VAR optimization performs this calculation in real-time, using measurements from along the feeder to determine power quality. Historical values of power factor (which measures power quality) can be used to inform the purchase of voltage regulators that maintain consistent voltage levels or capacitors that store energy to condition power. Here again, model-based design is supported by having this detailed power quality information.
One of the biggest intangible benefits of smart grid is that it has made the relationship between the customer and the utility a two-way conversation. No longer is the utility simply a faceless service provider, or the customer simply a number.
The adoption of smart grid has been contentious, fraught with miscommunication, misinformation and misunderstanding. But customers are finally stakeholders, and regulators ensure that their voice is heard, with many opportunities for improved collaboration. Model-based design is about analysis supporting design, but it is also about ensuring that multiple scenarios that weigh pros and cons affecting all stakeholders are considered. With more insight, customers are making their voices heard, and this new approach to design provides the means to consider multiple options.
About Erik Shepard
Erik Shepard, PMP, provides operational strategy, business justification, and project development and execution for utility technology projects through his firm, Waterbridge Consulting, and in partnership with Massachusetts-based BRIDGE Energy Group.


