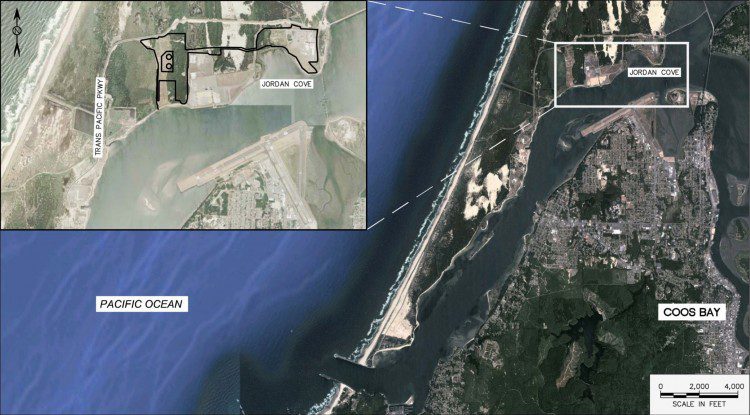
In the international port of Coos Bay, Ore., construction will begin in late 2016 on a liquefied natural gas (LNG) export terminal that will be the largest private construction project in the state’s history. The bay is separated from the ocean by a tongue of land varying in width from 0.3 miles at the entrance to 1.9 miles at Jordan Cove, where the plant will be built.
The facility requires access to the ocean for the deep draft vessels that will move its cargo to customers across the Pacific. However, this is a highly seismic area, so the facility had to be designed to withstand earthquakes as well as tsunamis.
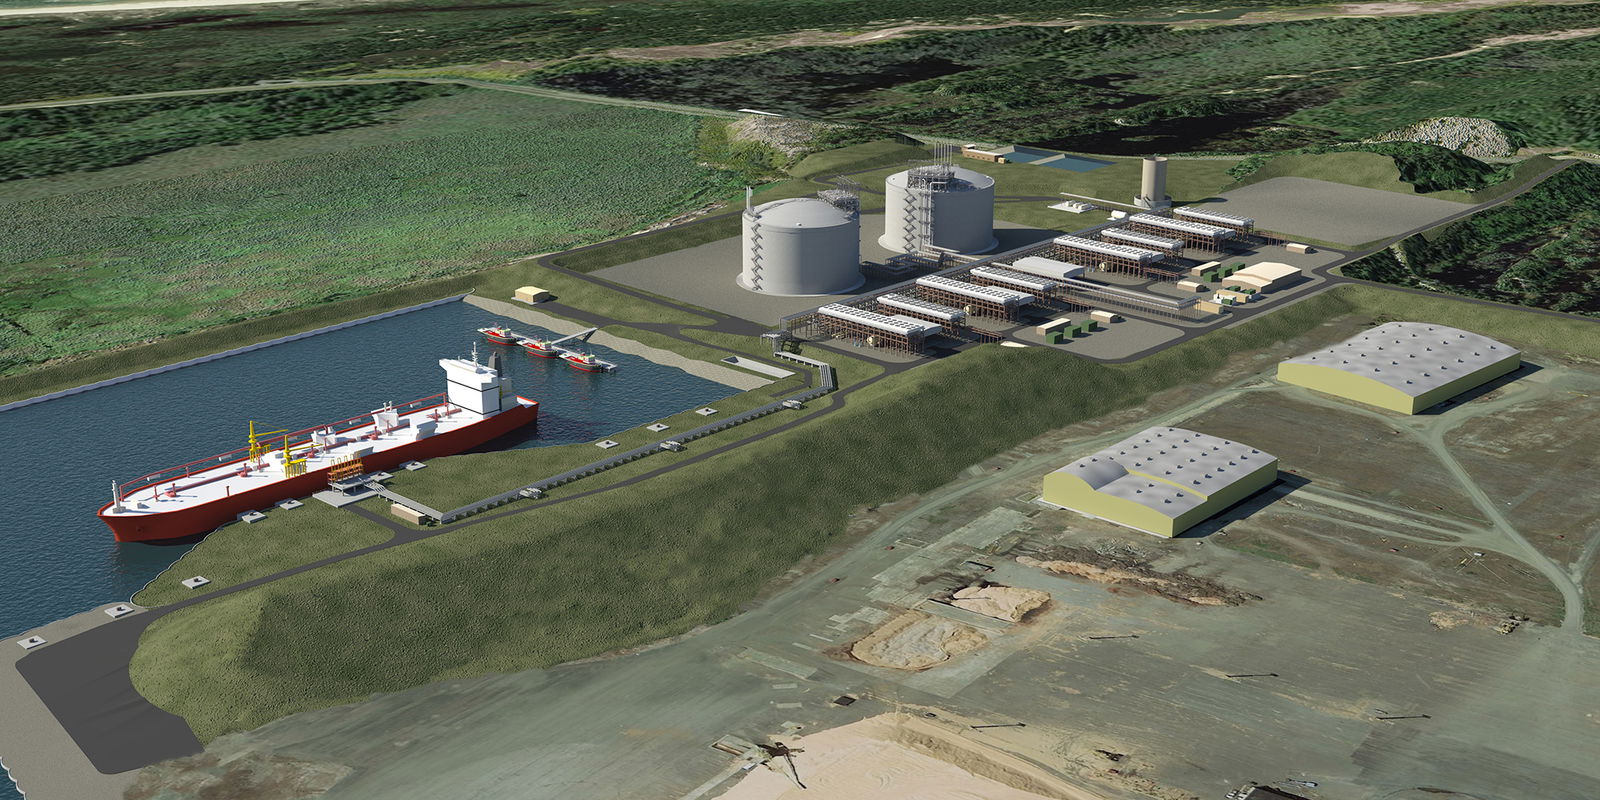
The Jordan Cove Energy Project
The Jordan Cove Energy Project (JCEP) consists of the LNG export facility and a natural-gas pipeline that connects it to major pipelines in the North American grid. The pipeline is 36 inches in diameter and will run for 232 miles, from the Oregon/California border up to Coos Bay.
The JCEP site covers approximately 400 acres that will include a marine terminal, a ship berth, an LNG loading facility, and a liquefaction facility capable of producing 6 million metric tons a year of LNG from a natural gas supply of about 1 billion cubic feet per day. It will take at least four years to build, with a peak labor requirement during construction of about 1,600 craftsmen. The facility itself will cost approximately $5 billion, and the pipeline about $1.5 billion.
The project’s parent company is Veresen Inc., based in Calgary, Canada, which owns and operates energy infrastructure projects (primarily in natural gas) as well as hydroelectric power plants and pumped-storage power plants in Canada in addition to power plants in the United States, pipeline systems and gas-processing facilities. It also owns and operates one of the largest natural-gas pipelines in North America, which runs from northeastern British Columbia all the way to Chicago.
“While an LNG facility is different from our other facilities, it is similar in terms of scale and the types of processing equipment that we deal with,” says Robert Braddock, senior project adviser for the JCEP. An engineer by training, he was responsible for most aspects of the project until early in 2014, when the project ramped up from a small operation to a pre-construction team of about 45 people.
The JCEP has been applying for the required permits for several years and has received almost all of them. According to Braddock, it expects to receive final approval from the Federal Energy Regulatory Commission (FERC) by the end of 2015 to begin pre-construction work around March 2016, full construction around October 2016 and be in service sometime in 2020. The project was originally conceived as an import terminal, but in 2013 it filed a new permit application with FERC to operate as an export terminal.
The project’s large footprint as well as a 234-mile linear footprint for the pipeline produces an extensive physical impact. “The pipeline crosses a couple of hundred individual properties, and securing rights of way is a major effort, but we are well underway on that,” notes Braddock.
The large size of LNG facilities poses significant management challenges, such as getting sufficient skilled labor and materiel into the area at a reasonable cost, especially away from large metropolitan areas, such as in Coos Bay. After construction, the facilities are “very benign,” according to Braddock, because “they are clean, they are quiet, and they don’t generate odors. They tend to blend in the background, and people don’t even know that they are there.”
However, according to the state’s largest newspaper, The Oregonian, the plant “could quickly become one of the largest greenhouse gas emitters in Oregon”.
Seismic Challenges
Any facility built on the Oregon coast faces the risk of earthquakes and tsunamis. A FERC-regulated facility must be able to withstand either type of natural disaster without threatening adjacent property owners or the community. While acknowledging that this is “a challenge,” Braddock points out that “LNG is a large energy source for Japan, which has to deal with a similar seismic environment. So there is a long, safe history of LNG use.”
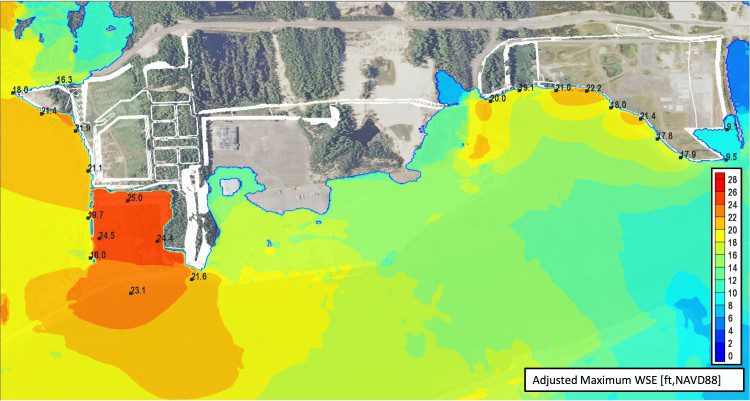
Modeling possible seismic and tsunami impacts requires a good understanding of topography at the site and surrounding areas. The JCEP and the Oregon Department of Geology and Mineral Industries (DOGAMI) have done a lot of this work in addition to hiring several expert firms to do additional modeling.
“Because of our proximity to the offshore Cascadia fault, the models anticipate that in a very large event we would see a subsidence of up to two meters,” notes Braddock.
Therefore, the JCEP had to ensure the facility’s location could withstand such subsidence as well as an incoming tsunami wave and an outwash tsunami trough. Its elevation also had to be sufficient to avoid inundation. This requires a good vertical control and a clear understanding of how terrain will be altered during a tsunami and earthquake as well as how such changes, in turn, will impact tsunami waves. This allows engineers to model the possible impact on the facility and determine which areas need to be armored, elevated or otherwise protected to withstand the event.
The studies conducted by the JCEP included bathymetric surveys of the bay. The main channel is a federal navigation channel, so it’s dredged and maintained by the U.S. Army Corps of Engineers. However, the JCEP will have to dredge a slip it’s building adjacent to the channel as well as the connection between the slip and the federal navigation channel. This will require moving about 6 million cubic yards of material, but it won’t be an ongoing maintenance job.
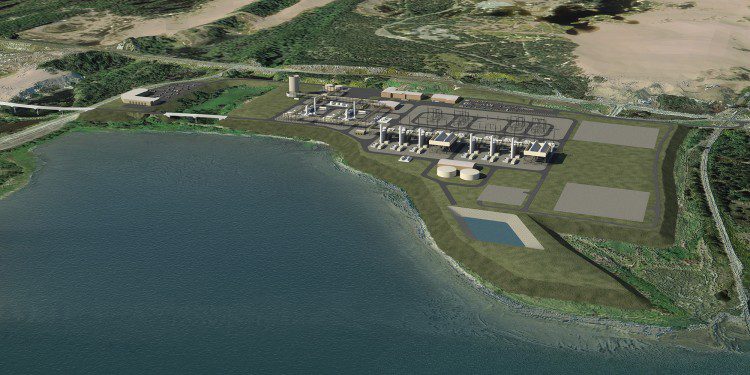
This aerial view by Coast & Harbor Engineering provides a perspective on Coos Bay and the project area’s proximity to the Pacific Ocean as well as a more detailed view of the existing site.
Collecting LiDAR Data
In 2007, the JCEP flew LiDAR from the bar at the entrance to the channel north to Highway 101 as well as over areas north, east and west of the project, for a total of about 15 square miles. It used the data to produce a topographic map at a one-foot contour interval that it has since used to design the facility and evaluate the locations, velocities and impacts of a possible earthquake or tsunami. “We think we have enough information at present to get us through the construction phase,” adds Braddock.
David Evans and Associates Inc. (DEA) wrote the requirements and set the controls for the LiDAR imaging, but it subcontracted the acquisition to TerraPoint. Required deliverables included point files of all LiDAR data collected, bare-earth elevation, LiDAR intensity, a one-foot contour of the site, and cross sections at specified intervals. For all data, the horizontal datum was in NAD83, and the vertical datum was in NAVD88 state-plane coordinates. To verify TerraPoint’s data, DEA shot random points throughout the project using base stations and RTK GPS.
The area’s sand dunes and frequent fog and rain made LiDAR collection challenging. “It is a huge project, and weather is always an issue on the coast,” says Gary Hutcheson, PLS, a senior associate and senior project manager at DEA. In addition, they had to time the flights to coincide with low tide to map the low-water areas.
“We were lucky we had an airport right across the bay from us to fly this, so that is where they were staged,” adds Hutcheson. “Also, LiDAR penetrates the very heavy vegetation in the area. This was done in 2007 and technology has vastly improved since then.”
The LiDAR data collected takes up two DVDs, copies of which were provided to all project participants.
Geophysical Analysis
To evaluate the site’s soil properties, including the potential for ground liquefaction and lateral spreading, the JCEP hired GRI, a geotechnical engineering firm with a focus on earthquake engineering projects. The company began working on this project in 2006 and conducted the geophysical exploration work in phases commensurate with the level of design and information requested by some of the contracting teams evaluating the project.
GRI conducted a substantial amount of geophysical work, including standard mud rotary drilling, cone penetration testing (CPT), seismic refraction and other geophysical evaluations. In some of the borings, GRI used suspension logging to calculate shear-wave velocities.
“We used several types of over-water and on-land geophysical work to help evaluate the subsurface profiles,” recalls Scott Schlechter, PE, GE, one of the company’s principals. “There was a large drilling program that incorporated all of those elements and the associated laboratory testing.”
GRI also collected some seismic-refraction data in the bay by towing a sensor behind a boat.
“The scale of seismic-hazard analysis and geotechnical engineering that goes into this project is greater by an order of magnitude than what goes into smaller projects,” adds Schlechter. “It is commensurate with the level or risk that goes along with this type of facility.”
There are some loose sands that need to be densified or otherwise treated to mitigate liquefaction hazards, and some areas contain organic material that hasn’t been stripped and needs to be taken into consideration. Overall, however, it’s a relatively firm site.
“Most of the measurement work has stabilized pretty well,” adds Hutcheson. “We often do checks out there to verify everything. On the hard surfaces, everything is still good. The dunes are always shifting, because of the winds and things like that—the area changes quite drastically from year to year. In the vegetated areas and on the road surfaces, everything is still very stable, and we’ve been able to verify that.”
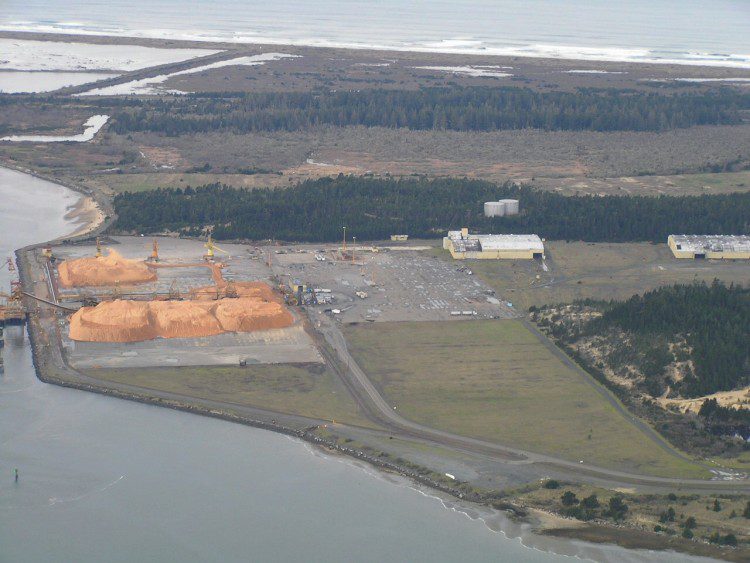
A model rendering shows the South Dunes Power Plant that will be built next to the liquefaction facility.
Tsunami Modeling
GRI also pulled together a team to perform the tsunami modeling, ensuring that its work was consistent with previous seismic-hazard analyses and modeling. It helped the team understand the changes proposed in the project area as well as the range of tsunami scenarios considered. It also provided available bathymetry data and topography, including the LiDAR data.
The starting point was modeling produced for the state of Oregon by Y. Joseph Zhang, a researcher at Oregon Health and Science University at the time but now at the Virginia Institute of Marine Sciences. He ran computer simulations that accounted for changes to the site’s bathymetry and topography proposed by the JCEP, such as those caused by constructing the large ship slip in front of the facility, which could change the subsurface profile in ways that would affect a tsunami’s runup. Zhang also used the LiDAR data to update the bathymetry and topography previously used by DOGAMI.
“We incorporated all of those changes into a site-specific tsunami model that can simulate the various offshore ruptures and how long a tsunami would come into the bay,” adds Schlechter.
As the project evolved and some earthquakes took place, Zhang and Vladimir Shepsis, of Coast & Harbor Engineering (now a division of Hatch Mott MacDonald), updated the source models of the offshore rupture scenarios that generated these potential tsunamis.
“They did the lion’s share of the modeling of those different rupture scenarios and coordinated them with DOGAMI and the controlling agencies to make sure everyone was on the same page as to what scenarios we were modeling and what was appropriate to the facility,” recalls Schlechter. The models can simulate the various types of ruptures caused by earthquakes and how far up the bay they would drive the water.
GRI served as liaison among the JCEP and regulatory agencies, ensuring that the tsunami modeling was consistent with their overall knowledge of the project and the earthquake engineering being done for the facility’s structural design.
Modeling was essential to help the JCEP team evaluate how a tsunami wave would behave as it runs up the long and narrow bay in which Jordan Cove is located. Whether the controlling wave comes up the west over the land or eight miles up through the river channel, the JCEP site in the bay is more protected than it would be if it were directly exposed to the Pacific Ocean.
Author
Matteo Luccio
Matteo Luccio has nearly twenty years of experience as a magazine writer and editor. He has a master’s degree in political science from MIT and co−founded the public policy magazine Oregon’s Future, which he edited for four years. For the past twelve years he has edited and written articles for technical magazines on geospatial technologies, the last five as president and founder of Pale Blue Dot.

.jpg?width=225)