EIA Expects that 2018 Gasoline Prices Have Peaked in the July Short-Term Energy Outlook
The U.S. Energy Information Administration released its Short-Term Energy Outlook (STEO) on Tuesday, July 10, 2018.
Forecast Highlights
- Brent crude oil spot prices averaged $74 per barrel (b) in June, a decrease of almost $3/b from the May average. EIA forecasts Brent spot prices will average $73/b in the second half of 2018 and will average $69/b in 2019. EIA expects West Texas Intermediate (WTI) crude oil prices will average $6/b lower than Brent prices in the second half of 2018 and $7/b lower in 2019. NYMEX WTI futures and options contract values for October 2018 delivery that traded during the five-day period ending July 5, 2018, suggest a range of $56/b to $87/b encompasses the market expectation for October WTI prices at the 95% confidence level.
- U.S. regular gasoline retail prices averaged $2.89 gallon (gal) in June, down 1 cent/gal from the average in May. EIA expects that 2018 monthly average gasoline prices peaked in May and forecasts prices to decline gradually in the coming months to an average of $2.83/gal in September. EIA expects regular gasoline retail prices to average $2.76/gal in 2018 and $2.77/gal in 2019.
- EIA estimates that U.S. crude oil production averaged 10.9 million barrels per day (b/d) in June, up 0.1 million b/d from the May level. EIA forecasts U.S. crude oil production to average 10.8 million b/d in 2018, up from 9.4 million b/d in 2017, and to average 11.8 million b/d in 2019. If realized, both of these forecast levels would surpass the previous record of 9.6 million b/d set in 1970.
- EIA forecasts that total U.S. crude oil and petroleum product net imports will fall from an annual average of 3.7 million b/d in 2017 to an average of 2.4 million b/d in 2018 and to an average of 1.6 million b/d in 2019, which would be the lowest level of net imports since 1958.
- EIA forecasts total global liquid fuels end-of-year inventories to be unchanged in 2018 compared with 2017, followed by a rise of 0.6 million b/d in 2019.
- U.S. dry natural gas production averaged 73.6 billion cubic feet per day (Bcf/d) in 2017. EIA forecasts dry natural gas production will average 81.3 Bcf/d in 2018, which would establish a new record. EIA expects natural gas production will rise by an additional 3.1 Bcf/d in 2019 to 84.5 Bcf/d.
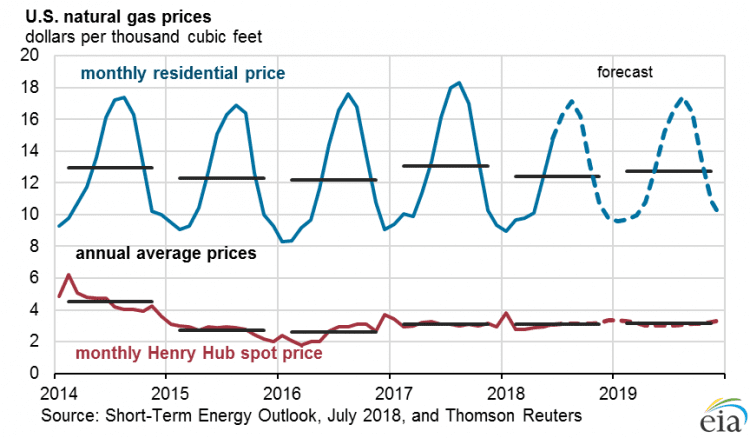
- The Henry Hub natural gas spot price averaged $2.97/million British thermal units (MMBtu) in June. EIA expects Henry Hub natural gas spot prices to average $2.99/MMBtu in 2018 and $3.04/MMBtu in 2019. NYMEX futures and options contract values for October 2018 delivery that traded during the five-day period ending July 5, 2018, suggest a range of $2.37/MMBtu to $3.59/MMBtu encompasses the market expectation for October Henry Hub natural gas prices at the 95% confidence level.
- EIA expects the share of U.S. total utility-scale electricity generation from natural gas-fired power plants to rise from 32% in 2017 to 34% in 2018 and to 35% in 2019. In this outlook, coal’s forecast share of electricity generation falls from 30% in 2017 to 28% in 2018 and to 27% in 2019. The nuclear share of generation was 20% in 2017 and is forecast to be slightly less than that share in 2018 and in 2019. Nonhydropower renewables provided slightly less than 10% of electricity generation in 2017 and are expected to provide more than 10% in 2018 and nearly 11% in 2019. The generation share of hydropower was 7% in 2017 and is forecast to be slightly less than that share in 2018 and in 2019.
- After declining by 0.9% in 2017, EIA forecasts that energy-related carbon dioxide (CO2) emissions will increase by 1.8% in 2018 and decrease by 0.5% in 2019. Energy-related CO2 emissions are sensitive to changes in weather, economic growth, energy prices, and fuel mix.