Fatality Mapping Project Highlights Construction-Related Deaths
Now in its sixth year, the Fatality Mapping Project (http://stopconstructionfalls.com/fatality-map) is raising awareness of the number of lives lost each year in construction. Developed by the Center for Construction Research and Training, a nonprofit organization created by the Building and Construction Trades Department, American Federation of Labor and Congress of Industrial Organizations, the maps include information from ongoing Occupational Safety and Health Administration investigations and online media sources. Although the maps don’t capture all work-related construction fatalities, they do portray a substantial number of fatal injuries, illustrating the need for improved health and safety in the construction industry.
During the 10-year period preceding the construction downturn, which began in 2008, the Bureau of Labor Statistics reported roughly 1,200 construction fatalities annually. Prior to the downturn and since, falls have accounted for roughly one-third of work-related deaths suffered by construction workers each year.
Sustainable Infrastructure Report Visualizes a Future for Water Infrastructure
A group of 50 industry experts recently came together from backgrounds in water supply, wastewater and stormwater infrastructure to develop a new report: A Northwest Vision for 2040 Water Infrastructure: Innovative Pathways, Smarter Spending, Better Outcomes.
The report, released by Evergreen State College’s Center for Sustainable Infrastructure, is the first attempt to construct a regional, shared vision for the future of water infrastructure in the Northwest. The report introduces a robust portfolio of new water infrastructure solutions, expanding the choices available and opening new opportunities for innovation. Download the free report at
PTI Announces Most Meritorious Technical Paper
Post-Tensioning Institute (PTI) presented its Kenneth B. Bondy Award for Most Meritorious Technical Paper to Alex Randell, a bridge designer at FINLEY Engineering Group; Marcelino Aguirre, a former bridge field engineer at the Walsh Group; and Trey Hamilton, a professor of civil engineering at the University of Florida. Their paper, “Effects of Low Reactivity Fillers on the Performance of Post-Tensioned Grout,” contains a summary of research performed in the area of reproducing and determining the cause of soft grout, which has been found in several bridges around the United States.
The PTI Technical Advisory Board presents awards annually to individuals who have made a significant contribution to the PTI body of knowledge. This year’s winning paper can be downloaded at
U.S. Citizens Recognize Benefits of Public Transportation
Almost nine in 10 U.S. citizens (88 percent) recognize public transportation systems provide a wide array of benefits to the communities they serve, according to a new HNTB Corporation America THINKS public opinion survey. The survey, “Public Transportation-2017,” found 83 percent of Americans have some type of public transportation option available where they live or work; 71 percent of those have used it at some point; and 51 percent have opted to use public transportation instead of driving in the last 12 months.
Americans identified an array of benefits provided by public transportation. Helping those who can’t drive was the benefit cited by more respondents (61 percent) than any other. Among others mentioned were providing travel choice (38 percent), offering a relaxing way to travel (28 percent), creating jobs (28 percent), access to jobs (28 percent) and contributing to cleaner air (27 percent).
Report: U.S. Faces Widespread Water System Violations
Nearly 77 million people—roughly a quarter of the U.S. population spread across all 50 states—were served by water systems reporting violations of the Safe Drinking Water Act in 2015, according to a recent report issued by the Natural Resources Defense Council (NRDC). The offenses ranged from arsenic to nitrate contamination, and included often-serious failures to test or report contamination levels. A new threat to the nation’s water supplies comes in the form of dramatic cuts to the U.S. Environmental Protection Agency’s 2018 budget—including programs designed to safeguard the nation’s drinking water—despite President Trump’s recognition that “crystal clear water” is vitally important to the country.
The report, Threats on Tap: Widespread Violations Highlight Need for Investment in Water Infrastructure and Protections, found nearly 80,000 violations impacting drinking water systems in every state, but under-reporting and lax enforcement could mean the number of violations is much higher. Very small systems found in rural or sparsely populated areas account for more than half of all health-based violations, and nearly 70 percent of all violations. For more information, visit www.nrdc.org/resources/threats-tap-widespread-violations-water-infrastructure.
U.S. Renewable Energy Use Has Grown Rapidly
A recent U.S. Energy Information Administration (www.eia.gov) Today in Energy brief indicates rapidly expanding use of renewable energy in the United States. Posted May 4, 2017, the brief states that wind generators accounted for 8 percent of the operating electric-generating capacity in the United States in 2016, more than any other renewable technology, including hydroelectricity. Wind turbines have contributed more than one-third of the nearly 200 gigawatts (GW) of utility-scale electricity-generating capacity added since 2007.
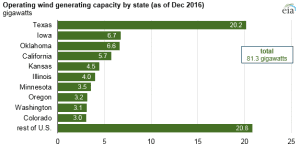
The increase in U.S. wind development during the last decade reflects a combination of improved wind-turbine technology, increased access to transmission capacity, state-level renewable portfolio standards, and federal production tax credits and grants. More than half of U.S. wind capacity is located in five states: Texas, Iowa, Oklahoma, California and Kansas. In three states—Iowa, Kansas and Oklahoma—wind makes up at least 25 percent of in-state utility-scale generating capacity. For more information, visit www.eia.gov/todayinenergy/detail.php?id=31032.
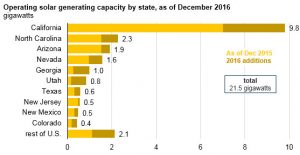
The brief also states that utility-scale solar installations—including photovoltaic (PV) and thermal technologies—grew at an average rate of 72 percent per year between 2010 and 2016, faster than any other generating technologies. Utility-scale solar generation now makes up about 2 percent of all utility-scale electric generation. The first utility-scale solar plants were installed in the mid-1980s, but more than half of the currently operating utility-scale solar capacity came online in the last two years. Although California has the highest total installed capacity of any state, several states have deployed significant utility-scale solar capacity in recent years.
In addition to utility-scale solar, electric-generating capacity from small-scale solar systems (such as rooftop and other customer-sited PV systems) has grown. In 2016, EIA estimates that the United States added 3.4 gigawatts (GW) of small-scale solar generating capacity across all three end-use sectors (residential, commercial and industrial), ending the year with more than 13.1 GW of installed capacity. Monthly generation from small-scale solar capacity is estimated to have been 1.6 million megawatt hours on average in 2016, or about two-thirds of the amount generated by utility-scale solar generators. For more information, visit www.eia.gov/todayinenergy/detail.php?id=31072.
TOP Stories
The following are the top stories from the last few months (in terms of traffic) on the Informed Infrastructure website. This also reflects key coverage areas that are regularly refreshed online and via our weekly e-newsletter. Simply search key words on Informed Infrastructure online to find the full story.
Buildings
• AISI Standards Council Small Project Fellowship Program Announces Winning Research Proposals
• Temporary Wooden Market Hall Becomes Eye-Catching Landmark
• Cortec Corporation Celebrates 40 Years of Fighting Corrosion
• Oldcastle Precast Earns Top Safety Awards from National Precast Concrete Association
Transportation
• Thousands of Arizonans Help Share ADOT’s Long-Range Transportation Plan
• Transportation Report Estimates 7 Million Drivers Will Shift to Autonomous Vehicles in 3 U.S. Cities
• Footage Shows I-85 Bridge Collapse in Atlanta
• Old Span Of Bay Bridge Going, Going, Gone
• Watch How Tappan Zee Bridge’s Main Span Towers Will Be Constructed
Water
• Take Control of the Wastewater from Your Home
• American Manufacturer Makes History In Rainwater Harvesting
• Closing the Water Infrastructure Investment Gap Creates Jobs and Strengthens the Economy
Tools and Technology
• Business Leaders World-Wide Agree and Commit to Disruptive Technologies Driving Sustainability
• IMAGINiT Technologies Acquires PacifiCAD
• Trimble Incorporates Galileo Support in New Version of its GNSS Infrastructure Management Software
• How Drone Data Delivers Real Bottom Line Value for SMBs in Construction
• 6 Major Construction Companies Adopt New Pix4D BIM Monitoring Solution

Parul Dubey
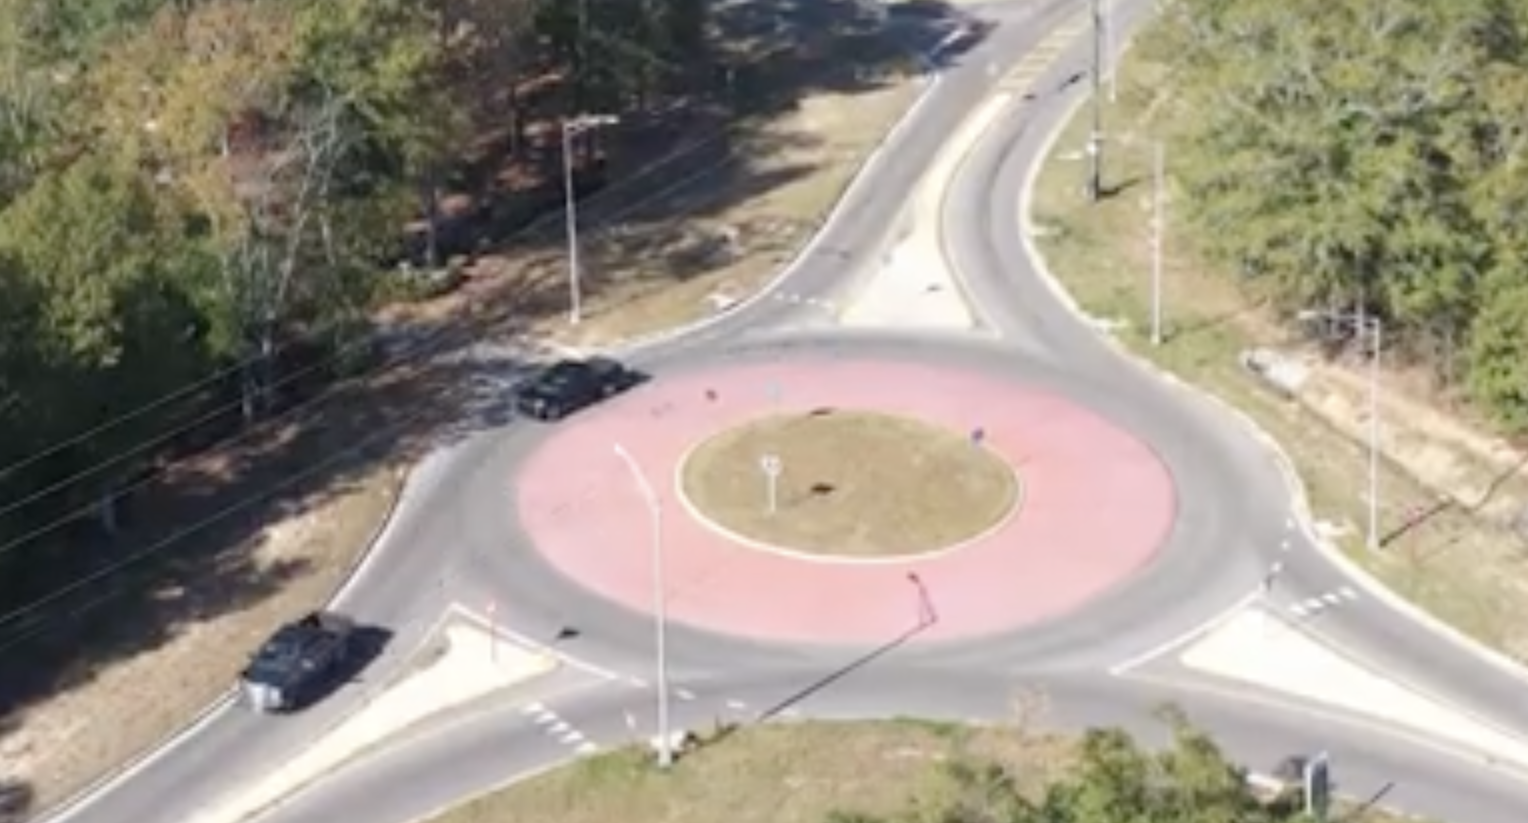
Video: New Roundabout Under Construction at McIver and Old Florence Roads in Darlington County
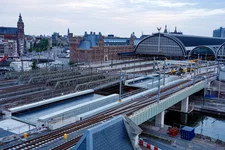
Bridge Replacement at Amsterdam Centraal Station
June Issue 2026
.jpg?width=225)