November – December 2016 TRENDS

Amtrak Delivers Strong FY 2016 Financial Results

To boost ridership, Amtrak added cars to high-demand or sold-out trains. Amtrak also improved its on-time performance and customer-satisfaction scores, and offered new services such as allowing pets and bikes on trains.
Amtrak reported strong unaudited financial results for the fiscal year ended Sept. 30, 2016 (FY 2016), including an all-time unaudited ticket revenue record of $2.14 billion, a $12 million increase over FY 2015. The increased ticket revenue was fueled by a record 31.3 million passengers—nearly 400,000 more than the previous year. This is the sixth consecutive year Amtrak has carried more than 30 million customers.
The company covered 94 percent of its operating costs with ticket sales and other revenues, up from 92 percent the year before. Unaudited total revenue was a record $3.2 billion for FY 2016. In addition, Amtrak reported an unaudited operating loss of $227 million, a reduction of $78 million over last year, and the lowest operating loss since 1973. Amtrak also was able to make a net reduction in long-term debt of $71.4 million.
“The results demonstrate the value we deliver to our customers and the vital role Amtrak plays in our nation’s transportation system,” said Anthony Coscia, Amtrak chairman of the board.
USDOT Reports Top Management Challenges for 2017
As required by law, the Office of Inspector General reports annually on the U.S. Department of Transportation (USDOT) and its top management challenges. For fiscal-year 2017, according to the report, USDOT faces eight major challenges:
1. Maintaining transportation safety while keeping pace with rapidly evolving technologies.
2. Bolstering vehicle and surface transportation safety.
3. Strengthening cybersecurity strategies to address increasing threats.
4. Strengthening controls to detect and prevent fraud, waste and abuse.
5. Enhancing the capacity, efficiency and resiliency of the national airspace system.
6. Increasing oversight of critical transportation infrastructure.
7. Enhancing oversight of acquisition and financial management.
8. Managing existing and new mandates and initiatives.
This report was included in the USDOT’s Annual Financial Report, and more details can be found at bit.ly/2eRDwSf.
China Leads Wave of Mega-Tall Towers

The Tianjin CTF Financial
Centre will be 530 meters tall,
with retail, parking, offices,
service apartments, a hotel
and club all stacked on top,
providing a total floor area of
350,000 square meters.
If America was the birthplace of the skyscraper, China is the current home of the “super-tall” tower. The Council for Tall Buildings and Urban Habitats defines a tower as super-tall when it tops 300 meters. So far, 97 have been completed around the world, and 36 are in China; of the 41 super-tall towers under construction, 27 are in China; and by 2020, China will be home to 14 of the tallest 20 buildings in the world.
And super-tall is just the beginning. Vincent Tse, managing director of building systems for WSP | Parsons Brinckerhoff in the China region, sees the era of the “mega-tall” building of 500-600 meters fast approaching.
“It’s mainly due to competition among major world cities: Seoul, Jeddah, Dubai, New York, Kuala Lumpur, Beijing, Shanghai, Shenzhen, Taipei, Bangkok, Jakarta,” noted Tse. “Every one of them wants to be number one of some kind, so the whole world remembers their landmark towers. That’s why developers and city planners are building mega-tall.”
Buildings are not only getting taller, they are also becoming more complex. With architects and developers seeking to stand out, “iconic” shapes are the norm. Although 90 percent of high-rise buildings were single-use offices before 2000, now 80 percent of mega-tall towers under construction are multi-use, combining commercial space with luxury hotels, service apartments, retail and leisure spaces.
Transform Financial Systems to Deliver Sustainable Infrastructure
A new report from the Global Commission on the Economy and Climate calls on governments and finance institutions to scale up and shift investment for sustainable infrastructure as a fundamental strategy to spur growth.
“Investing in sustainable infrastructure is essential to solve all the world’s most pressing problems,” said Felipe Calderón, former president of Mexico and chair of the Global Commission. “It’s key to reigniting global growth. It’s key to reducing poverty. And it’s key to meeting the Paris Agreement. Infrastructure can be the pillar on which we build a sustainable economy, or it can crumble beneath us. It all depends on whether we get financing right; only then will capital fully shift in the low-carbon direction.”
The report finds that investments totalling about $90 trillion will be needed in infrastructure during the next 15 years. The good news is that it does not need to cost much more to ensure that new infrastructure delivers a low-carbon economy consistent with the climate goals agreed in Paris, and fuel and other operational savings can fully offset any additional up-front investments.
Meeting these investment needs will require a combination of public and private investment, with public investment used strategically to help crowd-in or leverage further private investment. The report also breaks down future infrastructure needs by sector and country groupings. It finds that the “global south” will account for roughly two-thirds of investment, with energy and transport sectors dominating.
The full report can be accessed at bit.ly/2g5tqJw.
Insured Property Loss from Hurricane Matthew Estimated at $4-6 Billion
An analysis conducted by CoreLogic reported that insured property losses for residential and commercial properties from Hurricane Matthew are estimated to be between $4-6 billion from wind and storm-surge damage. This does not include insured losses related to additional flooding, business interruption or contents. Of this amount, 90 percent of the insurance claims are expected to be related to wind, and 10 percent are expected to be related to storm surge.
The fact that structures in the region are comprised primarily of masonry, wood and veneers, coupled with the stringent Florida building codes, helped reduce total insured property losses compared with other memorable storms.
The full analysis can be accessed at bit.ly/28Jn4N5.
|
Matthew (2016) |
Katrina (2005) |
Sandy (2012) |
Floyd (1999) |
David (1979) |
|
|
Total (In billions of dollars) |
$4-6 |
$35-40 |
$15-20 |
$3 |
$2 |
|
Storm Surge (Percent of total insured losses) |
10% |
70% |
60% |
5% |
1% |
|
Wind (Percent of total insured losses) |
90% |
30% |
40% |
95% |
99% |
A figure shows the insured property loss estimates for Hurricane Matthew compared with previous storms, including Hurricanes Katrina, Sandy, Floyd and David. The insured loss estimate from Hurricane Matthew is well above Hurricanes Floyd and David, but well below Hurricanes Katrina and Sandy.
EPA Introduces Guide for Long-Term Stormwater Planning
Urban stormwater continues to be a significant source of water pollution and public health concern. As communities continue to grow and develop their local economies, they look for sustainable and effective approaches to reduce these existing and emerging sources of pollution.
To help states and local governments develop and implement effective long-term stormwater plans, the Environmental Protection Agency (EPA) released a draft guide, Community Solutions for Stormwater Management: A Guide for Voluntary Long-Term Planning.

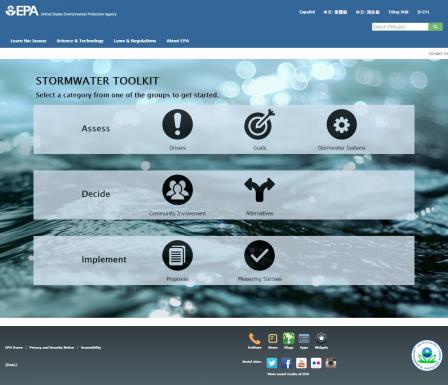
The landing page of the Stormwater Toolkit helps users
develop a long-term stormwater plan.
The document describes how to develop a comprehensive long-term community stormwater plan that integrates stormwater management with communities’ broader plans for economic development, infrastructure investment and environmental compliance. Through this approach, communities can prioritize actions related to stormwater management as part of capital improvement plans, integrated plans, master plans or other planning efforts.
The guide can be accessed at www.epa.gov/npdes/stormwater-planning.
The Growing Need for Advanced Water Treatment
Sprawling cities often lead to a buildup of waste, including dirty water. At first, cities were able to control the water going through the drains, but that’s changing—wastewater is a lot grittier and contains more contaminants than before.
To raise attention to this growing problem and propose changes that can be made in wastewater treatment, the University of California, Riverside, Online Masters in Engineering program created this accompanying infographic. Additional details and proposed solutions can be found at engineeringonline.ucr.edu.
Falling Costs and Tech Innovations Will Drive Offshore Wind-Power Boom
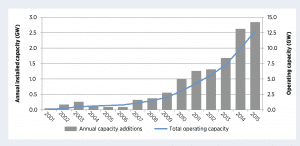
Offshore wind power has the potential to grow from 13 gigawatts (GW) in 2015 to 100 GW in 2030, according to Innovation Outlook: Offshore Wind, a new analysis from the International Renewable Energy Agency (IRENA). The report provides an overview of the future developments that will drive the offshore wind-power boom, including technology advancements and further cost declines.

Figures show the global annual installed and operating capacity for offshore wind farms, 2001-2015 (top), and worldwide offshore wind-farm deployment at the end of 2015.
“Offshore wind power is poised to become a leading power generation technology in a decarbonised global economy,” said Adnan Z. Amin, director-general of IRENA. “Now that onshore wind power is cost-competitive with conventional power-generation technologies, more attention is shifting to offshore applications.”
The report highlights upcoming innovations that will enable sector development, including next-generation wind turbines with larger blades, and floating turbines, which will open up new markets in deeper waters. These advancements, combined with other sector developments, are predicted to reduce average costs for electricity generated by offshore wind farms by 57 percent by 2045.
International Agency Keeps Nuclear in Plans for Clean Energy Future
A new report published by the International Energy Agency states that nuclear energy is an important pillar of a future energy system aimed at meeting the world’s growing energy needs and avoiding the worst effects of climate change.
The World Energy Outlook 2016 450 scenario, aimed at limiting an increase in global temperatures due to climate change to less than 2 degrees Celsius, shows global nuclear generation output increasing by almost two and a half times by 2040.
In this scenario, low-carbon energy sources dominate the generation mix. Hydro generates 20 percent, nuclear 18 percent, wind 18 percent and solar PV 9 percent. Fossil-fuel generation declines sharply, with gas supplying 16 percent, coal 9 percent and oil 1 percent. The remaining 9 percent is supplied by a range of other low carbon sources.
“We must meet the world’s growing energy needs and protect the planet,” said Agneta Rising, director general of the World Nuclear Association. “We will need all low-carbon energy options to work together to achieve this, and nuclear will make a major contribution, because it is scalable, reliable and competitive.”
TOP Stories
The following are the top stories from the last few months (in terms of traffic) on the Informed Infrastructure Website. This also reflects key coverage areas that are regularly refreshed online and via our weekly e-newsletter. Simply search keywords on Informed Infrastructure online to find the full story.
Buildings
- Puma HQ in El Salvador Receives COAM Award 2016
- Updated Renderings of 750-Foot Wolf Point East Tower Break Cover
- U.S. Embassy to Restore Iconic Nepal UNESCO Site Structure
- Autodesk Opens New BUILD Space for the Future of Making
- Vertical House in Dallas Wins National Steel Building Design Award
Transportation
- Georgia DOT Awards Over $79.3 Million in Statewide Project Contracts
- MDOT Moves Forward with Major Infrastructure Improvement Projects in District One
- PennDOT Starts Work on Mount Joy Train Station Improvements
- CINTEC America Provides Anchoring Systems for NYC MTA Subway
- Rhode Island DOT Reopens Hussey Bridge Eight Months Ahead of Schedule
Water
- Alternative Water Supply Expansion for Southern California Earns Top Industry Honor
- Black & Veatch and Royal HaskoningDHV Partner to Deliver Sustainable Water Solutions
- LA’s Shade Balls Actually Worked
- Dewberry Selected to Provide Water Resources Support to U.S. Army Corps of Engineers
- USAID Awards Tetra Tech $40 Million Contract for Water, Sanitation and Hygiene Finance
Tools and Technology
- CULTEC Lightweight Chambers Support Excess Ground Cover With Ease
- SmartBetterCities Released New Version of CloudCities Virtual Reality Tool
- Contech’s UrbanGreen Rainwater Harvesting Tank Receives Uniform Plumbing Code Certification
- Flexible Concrete Cloth Repairs Pipes, Goes Green
- Trimble Field Link Makes Construction Layout Easier—Scales to Contractors’ Needs


