Sponsored Content: One Forest, Multiple Perspectives
With nearly 60 percent of the country––23 million hectares (56.8 million acres)––covered in trees, forestry in Sweden is big business. The world’s second-largest exporter of paper, pulp and sawn-wood products, Sweden’s forest industry is valued at around 90 billion euros ($100.4 million)––about one-fifth of Sweden’s GDP––and employs about 200,000 people.
Managing Sweden’s forests also is serious business. Ensuring the sustainability and health of this wealthy asset falls mainly to private landowners (family enterprises own 50 percent of Swedish forests; private companies own an additional 25 percent) who assess and inventory their present-day holdings on regular intervals to develop long-term operational strategies.
Although forest owners have been quick to adopt technological tools such as aerial photography, optical satellite imagery and GIS software to assess their properties, the process of classifying forest land and delineating forest stands (i.e., a contiguous group of trees that are sufficiently homogeneous in species, density and size) typically has been a laborious combination of photogrammetry and drawing features by hand.
That process started to change, however, in 2008. That’s when Erik Heimsdal Iversen, a chief remote-sensing specialist at Danish international consulting group COWI, began building an automated forest-classification and mapping solution using light detection and ranging (LiDAR) data and other datasets with Trimble’s eCognition® image-analysis technology.
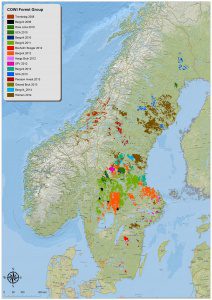
Erik Iversen and colleagues at COWI classified 5 million hectares (12.3 million
acres) of Swedish forests as well as swaths of forest in Finland and Uruguay.
“I knew LiDAR data would provide key vegetation height detail, and I knew the classification capabilities of eCognition, but I had never tried to classify and delineate large, heterogenous forest areas with the two together,” says Iversen, who works in COWI’s Norway office in Kongsberg. “The combination is particularly well suited for rapidly classifying vegetation and delineating forest stands. And it’s 10 times faster than photogrammetry.”
Indeed, with the elevation component of LiDAR and the classifying intelligence of eCognition, Iversen says they’ve been able to cut the traditional forest-mapping effort from several months to a few days, and they’re able to offer a more precise, flexible, customizable and repeatable technique that visualizes only the forest detail the customer wants to see.
The Right Mix
When Iversen first joined COWI’s GIS and IT department in 2008, the timing was opportune: COWI was interested in launching a forestry-mapping business, but wanted to find a more-efficient and flexible alternative to photogrammetry. Iversen also wanted to find a solution that would allow them to integrate valuable datasets such as old stand data to update their resources and create more detailed and informative maps.
Based on his experience with eCognition, Iversen thought the software would be the right tool to give them the flexibility to integrate diverse datasets and the automation to rapidly classify and map large swaths of forest.
Iversen built the first master rule set—the if/then processing tree the software follows to determine specific vegetative types—in about two months. The eCognition rule set was designed to classify nine different vegetative types, identify clear cuts, delineate stand borders, classify micro stands (i.e., variations in tree species or height within the main stand), distinguish productive forest and, where warranted, re-categorize unproductive forest land as productive.
Soon after building the eCognition solution, Swedish forest company Bergvik Skog needed to assess its 2.4-million-hectare forest to better define its forest stands and map its productive forest. It was the test case Iversen needed to determine the validity of the new methodology, and it was a veritable success.
Multiple Perspectives
Although the methodology can integrate diverse source data such as vector-based stand data, GIS data, raster imagery and LiDAR data to classify and map vegetation, Iversen designed the COWI solution to merge existing stand databases with LiDAR data to update the stand data, correct stand borders, classify the forest and precisely map the property.
For a typical forest-mapping project, Iversen first prepares the existing stand data––identifying inaccuracies and correcting them––and uses the LiDAR data to create a normalized digital surface model (nDSM) of tree heights, detail that’s integrated into the classification process. eCognition takes those inputs and segments the raster imagery into meaningful objects, based on spectral and spatial characteristics. Then it flags abnormal stand borders and corrects them, identifies clear cuts, and distinguishes between unproductive and productive forest. The software then classifies the tree and micro stands. With that classification foundation, Iversen can then produce customized maps per customer request.
While eCognition’s speed, flexibility and accuracy make it a viable alternative to photogrammetry, Iversen says the ability to combine historical stand data with the elevation detail of LiDAR is what sets this approach apart––and creates repeat customers.
Revisiting the Forest
One such repeat customer is Swedish forest company Orsa Besparingsskog (Orsa). Based in the town of the same name, Orsa is responsible for 80,000 hectares (198,000 acres) of forest in central Sweden about 15 kilometers north of Mora. As one of the early customers of the COWI eCognition method in 2010, it returned to COWI in January 2016 with a request to assess its forest volumes and update the stand borders based on those volumes and new clear cuts.
For the project, Iversen had Orsa’s existing vector database of stand polygons and a 2010 LiDAR-based nDSM. To prepare the data for processing, Iversen performed quality control checks on Orsa’s existing vector database of stand polygons and created five different nDSMs based on 2015 LiDAR data, all of which offer different features for analyzing sparse and non-sparse swaths of forests. He also developed an additional LiDAR-derived vegetation density raster index to provide a detailed view of the forest density.
In two days, Iversen developed the eCognition rule set to identify and delineate stand borders, distinguish vegetative types based on height, spectral qualities and textural features––a process similar to how the human brain distinguishes specific objects––and classify the vegetation.
Working in 20,000-hectare (50,000-acre) batches, the software automatically recognized stand border changes and delineated them, defined existing and new clear cuts, detected and delineated differences in the forest between 2010 and 2015 and divided unproductive areas into two classes, trees shorter or taller than four meters––a workflow that took 30 minutes. Iversen then spent about two days performing a supervised classification on those initial results.
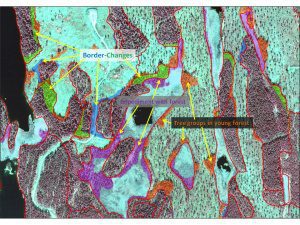
With COWI’s methodology, eCognition segments raster imagery into meaningful objects based on spectral and spatial characteristics. Then it flags abnormal stand borders and corrects them as well as identifies features such as impediments and tree groups.
After the first round of processing, Iversen ran eCognition again to determine if stands needed to be further divided, to pinpoint the micro stands and perform a final classification of the forest cover, down to the position and heights of individual trees. The second analysis also took 30 minutes to complete. He repeated that process four times, automatically classifying Orsa’s 80,000 hectares of forest in four hours. After the classification process was complete, the data were automatically integrated into ArcGIS to further analyze the data and produce customized maps.
By March, Iversen had prepared three map layers showing forest volume, stands and micro stands, and nine different forest classes, including new clear cuts. Plotted across a standardized grid, each stand and micro stand had an individual ID, along with its corresponding attributes such as size, age and tree heights. Upon receiving the forest inventory from Iversen, Orsa field tested the information and reported the maps were 95 percent accurate.
“Now Orsa not only has a detailed comparison of its forest between 2010 and 2015, they have a completely new, informative tool that can help them develop cost-effective planning and management strategies,” notes Iversen. “What’s more, we can repeat the same process or challenge the software to extract a whole new set of details that we haven’t produced before.”