January – February 2015 TRENDS
In this section, Informed Infrastructure compiles infographics from trusted sources that reveal insight on infrastructure spending. We also compile some of the top infrastructure stories that shouldn’t be missed.
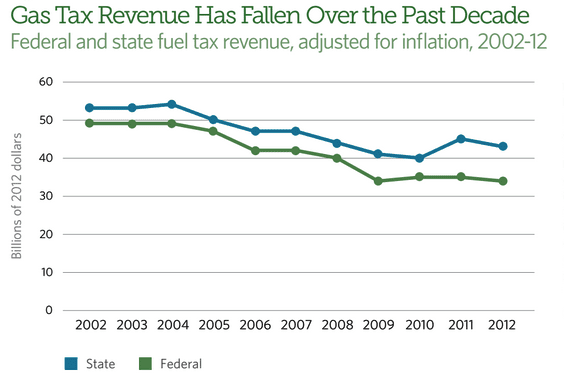
The Plummeting Price of Oil and Its Impact on Transportation Funding
In 2014, the balance in the U.S. Department of Transportation’s federal Highway Trust Fund dipped so low that payments to states for work underway was delayed. The shortfall is part of a decade-long trend where revenue has fallen short of expenditures for roads and transit infrastructure. Congress approved a stopgap measure to fund transportation projects, but that will last only until May 2015.
Gas-tax revenues, which are one of the largest sources of funds, have suffered as vehicle fuel efficiency has improved, driving habits have changed and most recently because fuel prices have plummeted. At the federal level and in most states, gas taxes have remained at a fixed amount per gallon even as transportation construction costs have risen, contributing to a 25 percent decline in states’ own transportation funding over that span, according to a Pew Charitable Trusts report.The federal gas tax has not been raised since 1993, and given the increasing shortfall, there is growing bi-partisan call for funding reform.
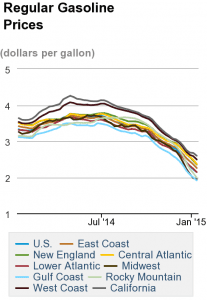
U.S crude-oil prices were $50 per barrel in mid-January 2015, down more than 50 percent from the mid-June 2014 price of $107. Gasoline prices were at $3.60 per gallon in mid-July and just $1.75 per gallon in mid-January.
Counties Recover at Varying Rates
The National Association of Counties recently released its annual county economic tracker. The survey details the economic conditions for the 3,069 county economies in the United States. Five indicators are tracked every year, including the annual change in jobs, unemployment rates, economic output (GDP) and median home price.
Some findings that indicate we’re on a rebound from the recession, but not with even distribution, include the following:
- Economic output has recovered in 45 percent of counties.
- Nearly 95 percent of counties remain below their pre-recession employment levels.
- The majority of fully recovered county economies had less than 50,000 people, and most of them had strong energy and agriculture sectors.

See more details, and an interactive map.
Nonresidential Construction Shows Signs of Growth
A report in early January 2015 of nonresidential building projects in planning showed a rise of 4 percent in December 2014 and a 17 percent rise from a year ago. The steady increase of the Dodge Momentum Index, rebounding from dramatic declines that began in Feb. 2009 through Aug. 2011, indicates that construction recovery will continue into 2015.
Nine commercial building projects exceeding $100 million entered into planning during December, including the $150 million Phase 1 of the Google campus in Boulder, Colo.; a $150 million retail complex in New Brunswick, N.J.; the $135 million Monarch Hotel in Black Hawk, Colo.; a $100 million office tower in Chicago; a $100 million office tower in Sunnyvale, Calif.; and the four phases of the Cannon House office renewal in Washington, D.C. (each phase valued at $100 million).
The 2015 Dodge Construction Outlook predicts that U.S. construction starts will rise 9 percent for the year, a greater gain than the 5 percent estimated for 2014.

Source: Dodge Data & Analytics
Global Infrastructure Outlook Colored by Solving Societal Problems
A report released late in 2014 looked at global trends in large infrastructure projects, with an increased focus placed on impact and innovation. The “Infrastructure 100: World Markets Report,” from KPMG International, signaled an increased alliance between government and the private sector to overcome funding hurdles and invest in projects that could improve quality of life.
The 100 projects selected by the panel were from mature markets, economic powerhouses, smaller established markets and emerging markets. The role of private investment had different dynamics in each segment, and each country has its own approach, while all share the universal challenge of attracting investment that’s sorely needed.
Although the report advocates for profound economic, social and and environmental impacts of infrastructure spending, it also laments the failure to date of technological innovations to dramatically improve the cost and flexibility of infrastructure implementation. The revolutionary emergence of mobile telephony to rapidly connect the world is an example of swift infrastructure change that has created major new market benefits when advancements have occurred.
The report provides an interesting and inspirational global picture of projects that represent infrastructure excellence through their scale, feasibility, complexity, innovation or impact on society.
TOP Stories
The following are the top stories from the last few months (in terms of traffic) on the Informed Infrastructure Website. This also reflects key coverage areas that are regularly refreshed online and via our weekly e-newsletter. Simply search keywords on Informed Infrastructure online to find the full story.
Buildings
- Outstanding Structural Engineering Projects Honored
- Back to Future with Roman Architectural Concrete
- 3D Laser Mapping to Revolutionize Building Surveys
- Sustainable Design and Green Building Standards Revised
- Frost & Sullivan Honors Building Technologies with 2014 European Building Technologies Company of the Year Award
Transportation
- The I-95 Corridor Coalition Improves Insights with the Addition of Real-Time Traffic Information
- U.S. Transportation Secretary Foxx Announces $996 Million Grant Agreement to Expand Green Line Light Rail Service in Boston Area
- U.S. Bicycle Route System Grows to Over 8,000 Miles
- Illiana Corridor Project Receives Federal Approval
- The U.S. Department of Transportation (USDOT) Plans for the Future of Intelligent Transportation Systems (ITS)
Water
- Aguas Andinas Extends Use of Bentley’s Hydraulic and Hydrology Products
- Toowoomba Regional Council Tackles the Challenges of a Failing Common Effluent System
- Great Lakes Pollution No Longer Driven by Airborne Sources; Land, Rivers Now Bigger Factors
- Cities Look to Nature to Bridge Water Investment Gap
- America’s WETLAND Foundation Report Says Private Investment Can Restore Coast
Tools and Technology
- AutoCASE Eases Triple Bottom Line Analysis for Infrastructure Projects
- FARO Launches User-Friendly Handheld 3D Laser Scanner
- New Version of WaterCAD and WaterGEMS Extends Information Mobility Across Engineering and Operations
- SpaceCurve Announces First Spatial Data Platform to Transform Space and Time into Real-Time Operational Intelligence
- Autodesk Amps Up BIM with Expanded Cloud-based Collaboration Services